. 2008 Oct;124(4):2406-20.
doi: 10.1121/1.2967836.

Acoustic characterization of high intensity focused ultrasound fields: a combined measurement and modeling approach

Affiliations

Acoustic characterization of high intensity focused ultrasound fields: a combined measurement and modeling approach

Michael S Canney et al. J Acoust Soc Am. 2008 Oct.

Abstract

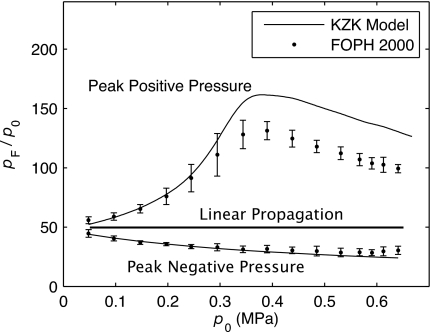
Acoustic characterization of high intensity focused ultrasound (HIFU) fields is important both for the accurate prediction of ultrasound induced bioeffects in tissues and for the development of regulatory standards for clinical HIFU devices. In this paper, a method to determine HIFU field parameters at and around the focus is proposed. Nonlinear pressure waveforms were measured and modeled in water and in a tissue-mimicking gel phantom for a 2 MHz transducer with an aperture and focal length of 4.4 cm. Measurements were performed with a fiber optic probe hydrophone at intensity levels up to 24,000 W/cm(2). The inputs to a Khokhlov-Zabolotskaya-Kuznetsov-type numerical model were determined based on experimental low amplitude beam plots. Strongly asymmetric waveforms with peak positive pressures up to 80 MPa and peak negative pressures up to 15 MPa were obtained both numerically and experimentally. Numerical simulations and experimental measurements agreed well; however, when steep shocks were present in the waveform at focal intensity levels higher than 6000 W/cm(2), lower values of the peak positive pressure were observed in the measured waveforms. This underrepresentation was attributed mainly to the limited hydrophone bandwidth of 100 MHz. It is shown that a combination of measurements and modeling is necessary to enable accurate characterization of HIFU fields.


Figures

Figure 1
Figure 1
A diagram of the experimental arrangement used for measurements of pressure waveforms.
Figure 2
Figure 2
Comparison of axial and focal scans of the low amplitude (“linear”) pressure field measured in water by the SEA hydrophone and calculated with the linearized KZK equation, along with the O’Neil analytic solution (Ref. 11). The beam plots were used to determine the radius of curvature and aperture of the source input to the KZK model.
Figure 3
Figure 3
Comparison of focal waveforms simulated with the KZK model and measured with the FOPH 2000 and NTR hydrophones in water for a source pressure amplitude of p0=0.1 MPa (IL=700 W∕cm2, IN=720 W∕cm2). Under slightly nonlinear propagation conditions, the focal pressure level was sufficiently high to be measured with two calibrated hydrophones.
Figure 4
Figure 4
Comparison of focal waveforms and corresponding spectra simulated with the KZK model and measured with the FOPH 2000 in water for p0=0.29 MPa (IL=6500 W∕cm2, IN=8200 W∕cm2), p0=0.39 MPa (IL=11 000 W∕cm2, IN=16 000 W∕cm2), and p0=0.57 MPa (IL=24 000 W∕cm2, IN=29 000 W∕cm2). The horizontal arrows in the waveform plots depict the peak positive pressure measured and modeled. At these output levels, the waveforms are strongly distorted, contain shocks, and the harmonic content of the waveforms extends beyond 100 MHz. The agreement between modeling and measurement results is good, although, when sharp shocks are present (p0=0.39 and 0.57 MPa), the measurements show lower peak positive pressures and lower values of harmonic amplitudes at high frequencies.
Figure 5
Figure 5
Comparison of measured and modeled pressures axially and in the focal plane in water for p0=0.39 MPa (IL=11 000 W∕cm2, IN=16 000 W∕cm2). Shown on the left are the transverse distributions for the peak positive, p+, and peak negative, p, pressures as well as for the first four harmonics. The axial data are shown on the right. The combination of nonlinear propagation and diffraction results in narrowing of the harmonic beamwidths and asymmetry of the waveform at the focus, which was captured by both measurement and modeling.
Figure 6
Figure 6
Summary of focal pressures measured and modeled with increase in the source operation level. The pressures are normalized by the source pressure amplitude, p0, illustrating the change in the focusing gain due to combined nonlinear and diffraction effects. The error bars indicate the standard deviation of three different measurements. Nonlinear propagation effects, which are stronger at higher p0, lead first to a higher gain in peak positive pressure. However, the gain falls off as shocks form prefocally, leading to increased attenuation before reaching the focus. The focusing gain for the peak negative pressure monotonically decreased as the source pressure amplitude increased.
Figure 7
Figure 7
Comparison of focal waveforms measured and modeled in a 7% BSA-acrylamide tissue-mimicking gel phantom for p0=0.1 MPa (IL=IN=560 W∕cm2) and p0=0.39 MPa (IL=9100 W∕cm2, IN=12 000 W∕cm2). The arrows in the p0=0.39 MPa plot indicate the peak pressures measured and modeled. The agreement is good, but the peak positive pressure is lower for the measured waveform when the shock is present. The waveforms were able to be measured in the phantom, and although of lower amplitude because of increased attenuation, they are of identical shape to comparable amplitude waves measured in water.
Figure 8
Figure 8
The waveforms for p0=0.39 MPa calculated using the KZK model at focus and averaged over 100, 300, and 500 μm diameter circular cross sections, representing increasing hydrophone sizes. Spatial averaging over the finite hydrophone size caused less than <2% reduction in peak amplitude at the narrowest beamwidth for the 100 μm diameter FOPH hydrophone but would cause a significant reduction with larger hydrophones.
Figure 9
Figure 9
The reconstructed velocity distribution across the transducer surface from low amplitude measurements using acoustic holography (top left). The surface is seen to have very periodic radial surface waves where black color corresponds to higher and white to lower values of velocity. A cross section of the radially averaged source velocity that was used as the boundary condition in the numerical model assuming uniform (dashed) and nonuniform (solid) vibrations (top right). Comparison of low amplitude axial pressures measured and modeled with uniform and nonuniform boundary conditions (bottom).
Figure 10
Figure 10
Axial distributions of the peak positive and negative pressures calculated for p0=0.39 MPa with uniform and nonuniform boundary conditions. The vertical line in the picture indicates the location of the focus, where pressure waveforms are calculated under the same conditions and shown on the top right. The nonuniform boundary condition is more accurate in modeling nearfield pressure patterns and may be useful for predicting side effects such as skin burns. However, the focal waveforms are almost indistinguishable when calculated with both uniform and nonuniform boundary conditions.
Figure 11
Figure 11
A typical focal waveform measured using the FOPH hydrophone at p0=0.39 MPa calibrated with and without deconvolution with the manufacturer’s impulse response. At low values of p0, where the wave is sinusoidal, the need for deconvolution is not obvious and a linear calibration from volts to pressure can be used. However, at higher p0, the directly measured waveform significantly overpredicts the peak positive pressure and distorts the waveform shape; therefore deconvolution is necessary.
Figure 12
Figure 12
The step response of the FOPH 500 and FOPH 2000 hydrophones calculated by integrating the manufacturer’s provided impulse response (top). A comparison of the transfer function of the FOPH hydrophone (middle). The figure is composed of five different curves. Labeled (1) is the theoretical transfer function resulting from diffraction at a 100 μm tip (Ref. 44). The frequency transfer functions for the FOPH 2000 (2) and FOPH 500 (3) calculated from the step response (a) and obtained by comparison with the model predictions (b). Comparison of focal waveform measured with the FOPH 2000 and FOPH 500 hydrophones for p0=0.39 MPa (bottom). The smaller bandwidth of the FOPH 500 hydrophone results in a diminished peak positive pressure and shock amplitude as compared to the FOPH 2000.

References

    1. Poissonnier L., Chapelon J.-Y., Rouviere O., Curiel L., Bouvier R., Martin X., Dubernard J. M., and Gelet A., “Control of prostate cancer by transrectal HIFU in 227 patients,” Eur. Urol. EUURAV10.1016/j.eururo.2006.04.012 51, 381–387 (2007). - DOI - PubMed
    1. Kennedy J., Wu F., ter Haar G., Gleeson F., Phillips R., Middleton M., and Cranston D., “High-intensity focused ultrasound for the treatment of liver tumours,” Ultrasonics ULTRA310.1016/j.ultras.2004.01.089 42, 931–935 (2004). - DOI - PubMed
    1. Huber P., Jenne J., Rastert R., Simiantonakis I., Sinn H., Strittmatter H., von Fournier D., Wannenmacher M., and Debus J., “A new noninvasive approach in breast cancer therapy using magnetic resonance imaging-guided focused ultrasound surgery,” Cancer Res. CNREA8 61, 8441–8447 (2001). - PubMed
    1. Illing R., Kennedy J., Wu F., ter Haar G., Protheroe A., Friend P., Gleeson F., Cranston D., Phillips R., and Middleton M., “The safety and feasibility of extracorporeal high-intensity focused ultrasound (HIFU) for the treatment of liver and kidney tumours in a Western population,” Br. J. Cancer BJCAAI10.1038/sj.bjc.6602803 93, 890–895 (2005). - DOI - PMC - PubMed
    1. Hynynen K. and Clement G., “Clinical applications of focused ultrasound—The brain,” Int. J. Hyperthermia IJHYEQ 23, 193–202 (2007). - PubMed

Publication types