

Interstate variation in the burden of fragility fractures
- PMID: 19063680
- PMCID: PMC3276341
- DOI: 10.1359/jbmr.081226
Interstate variation in the burden of fragility fractures
Abstract
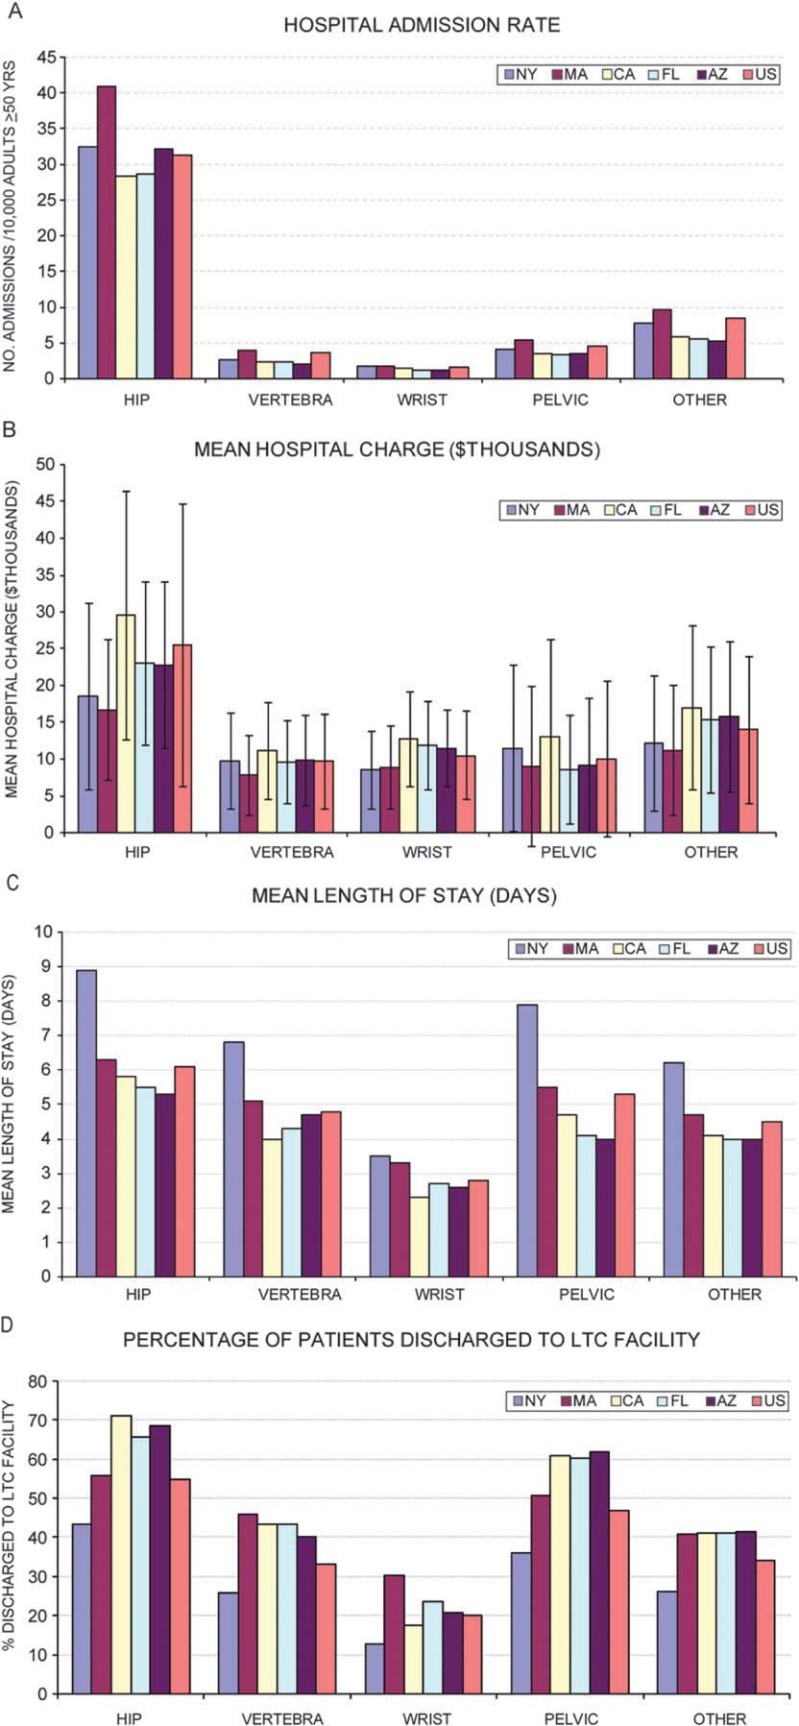
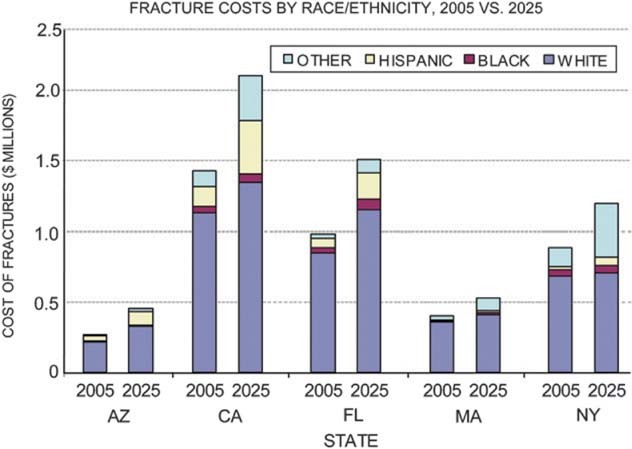
Demographic differences may produce interstate variation in the burden of osteoporosis. We estimated the burden of fragility fractures by race/ethnicity, age, sex, and service site across five diverse and populous states. State inpatient databases for 2000 were used to describe hospital fracture admissions, and a Markov decision model was used to estimate annual fracture incidence and cost for populations >or=50 yr of age for 2005-2025 in Arizona (AZ), California (CA), Florida (FL), Massachusetts (MA), and New York (NY). In 2000, mean hospital charges for incident fractures varied 1.7-fold across states. For hip fracture, mean charges ranged from $16,700 (MA) to $29,500 (CA), length of stay from 5.3 (AZ) to 8.9 days (NY), and discharge rate to long-term care from 43% (NY) to 71% (CA). In 2005, projected fracture incidence rates ranged from 199 (CA) to 266 (MA) per 10,000. Total cost ranged from $270 million (AZ) to $1,434 million (CA). Men accounted for 26-30% of costs. Across states, hip fractures constituted on average 77% of costs; "other" fractures (e.g., leg, arm), 10%; pelvic, 6%; vertebral, 5%; and wrist, 2%. By 2025, Hispanics are projected to represent 20% of fractures in AZ and CA and Asian/Other populations to represent 27% of fractures in NY. In conclusion, state initiatives to prevent fractures should include nonwhite populations and men, as well as white women, and should address fractures at all skeletal sites. Interstate variation in service utilization merits further evaluation to determine efficient and effective disease management strategies.
Figures
References
-
- National Osteoporosis Foundation. America's Bone Health: The State of Osteoporosis and Low Bone Mass. Washington, DC, USA: National Osteoporosis Foundation; 2002.
-
- Burge R, Dawson-Hughes B, Solomon DH, Wong JB, King A, Tosteson A. Incidence and economic burden of osteoporosis-related fractures in the United States, 2005–2025. J Bone Miner Res. 2007;22:465–475. - PubMed
-
- U.S. Census Bureau. 2004. Projected population of the United States, by race and Hispanic origin: 2000-2050. U.S. Interim Projections by Age, Sex, Race, and Hispanic Origin. Available online at http://www.census.gov/ipc/www/usinterimproj/natprojtab01a.pdf. Accessed October 2, 2007.
-
- Centers for Disease Control and Prevention. Fatalities and injuries from falls among older adults—United States, 1993-2003 and 2001-2005. MMWR Morb Mortal Wkly Rep. 2006;55:1221–1224. - PubMed
-
- Zingmond DS, Melton LJ, III, Silverman SL. Increasing hip fracture incidence in California Hispanics, 1983 to 2000. Osteoporos Int. 2004;15:603–610. - PubMed
Publication types
MeSH terms
Grants and funding
LinkOut - more resources
Full Text Sources
Medical
