. 2009 May;24(5):899-907.
doi: 10.1359/jbmr.081232.

muCT-based measurement of cortical bone graft-to-host union

Affiliations

muCT-based measurement of cortical bone graft-to-host union

David G Reynolds et al. J Bone Miner Res. 2009 May.

Abstract

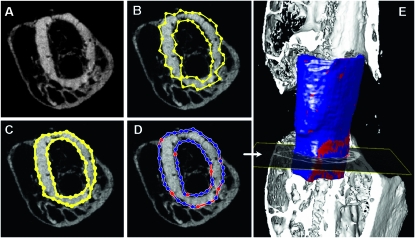
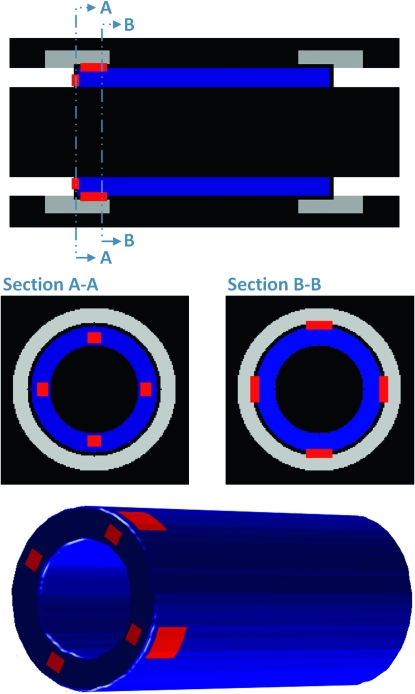
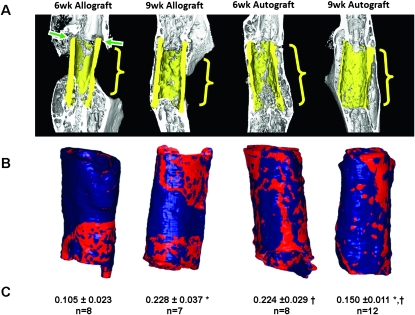
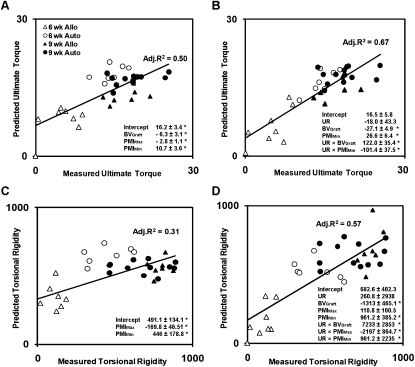
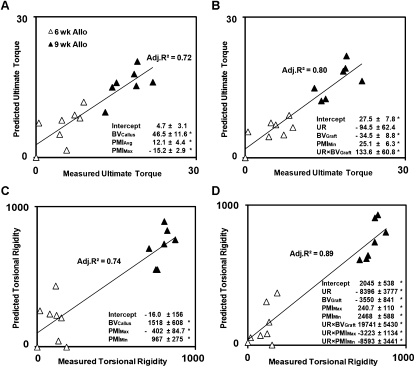
Evaluation of structural bone grafts risk of failure requires noninvasive quantitative predictors of functional strength. We hypothesized that a quantitative graft-to-host union biometric would correlate significantly with biomechanical properties as a surrogate for the risk of fracture. To test this, we developed a novel algorithm to compute the union between host callus and graft, which was termed the union ratio. We compared the union ratio of live autografts to devitalized allografts implanted into the mid-diaphysis of mouse femurs for 6 and 9 wk. Surprisingly, the autograft union ratio decreased from 0.228 +/- 0.029 at 6 wk to 0.15 +/- 0.011 at 9 wk (p < 0.05) and did not correlate with the torsional properties of the autografts. The allograft union ratio was 0.105 +/- 0.023 at 6 wk but increased to 0.224 +/- 0.029 at 9 wk (p < 0.05). As a single variable, the union ratio correlated significantly with ultimate torque (R (2) = 0.58) and torsional rigidity (R (2) = 0.51) of the allografts. Multivariable regression analyses of allografts that included the union ratio, the graft bone volume, the maximum and minimum polar moment of inertia, and their first-order interaction terms with the union ratio as independent variables resulted in significant correlations with the ultimate torque and torsional rigidity (adjusted R (2) = 0.80 and 0.89, respectively). These results suggest that, unlike live autografts, the union between the devitalized allograft and host contributes significantly to the strength of grafted bone. The union ratio has important clinical implications as a novel biometric for noninvasive assessment of functional strength and failure risk.


Figures

FIG. 1
FIG. 1
Illustration of the graft-to-host union ratio algorithm. A user outlines the surface of the graft using contours on transverse μCT slices (A). The semiautomated algorithm developed using MATLAB then optimizes the manually defined contours drawn around the endosteal and periosteal surfaces (yellow lines) (B). The contours are first snapped to the graft boundary by edge detection (C) and then dilated into darker regions away from the graft surface, finding the gap between graft and callus, if it exists (red denotes voxels that are adjacent to host bone/callus and blue denotes voxels that are adjacent to host soft tissue) (D). The resulting 2D contour from one slice is copied to the next slice, and the edge detection and gap-finding operations are performed. This process is repeated on each slice until the entire graft is enclosed in contours. A smoothed 3D shell is generated from the contours using MATLAB's isosurface function (E). The footprint of bone penetrating the shell therefore defines connection areas between the graft and host or callus. The union ratio is defined as the lowest area of the connections (red regions) in either the proximal or distal one half of the graft divided by the corresponding surface area of the graft half.
FIG. 2
FIG. 2
Algorithm validation using a digital model. An idealized cylindrical graft (blue) between host cortical bone (white) and callus (light gray) was digitally generated in MATLAB and used to validate the union ratio measurement. The graft was given defined rectangular regions of union to the host directly (section A-A) as well as between the graft and the callus forming around it (section B-B). The theoretical union area (red regions) based on the idealized geometry projected onto the curved surface was 2173.2 pixels2. Using the contouring computational algorithm, the measured area was 2171.4 pixels2, resulting in a measurement error of only 0.08%.
FIG. 3
FIG. 3
Representative μCT sagittal sections of 6- and 9-wk allografts and autografts (A) with the corresponding union area maps and union ratio numerical values (B). The graft bone is highlighted in yellow. Red indicates areas where the graft is connected to the host. Note that the areas of union and nonunion (green arrows) correspond accurately to the measured union areas on the surface of the graft represented in red. Note also that union with the periosteal and endosteal surfaces, and the ends of the graft were all accounted for. The proximal and distal halves of the graft were evaluated separately, and the lowest value of the union area normalized by the surface area was reported as the union ratio (C) (mean ± SE). Significantly different means: p < 0.05 between time points for each graft type and *p < 0.05 between graft types at each time point.
FIG. 4
FIG. 4
Multivariable linear regression analysis of geometric μCT-based parameters including bone volume, PMI, and union ratio. The regression analysis was performed without union ratio (A and C) and with union ratio (B and D) for the combined set of autografts (Auto) and allografts (Allo). Adjusted R 2 and the significant regression coefficients are indicated on each graph with their ±SE. *Independent variables or the interaction terms are significant (p < 0.05).
FIG. 5
FIG. 5
Multivariable linear regression analysis of geometric μCT-based parameters including bone volume, PMI, and union ratio for allografts only. The regression analysis was performed without union ratio (A and C) and with union ratio (B and D) for allografts only. Adjusted R 2 and the significant regression coefficients are indicated on each graph with their ±SE. *Independent variables or the interaction terms are significant (p < 0.05).
FIG. 6
FIG. 6
Estimating the union area from clinical CT data of human patients. Clinical X-rays and CT scan data of an anonymous patient's fractured tibia before and after 4 mo of teriparatide therapy were obtained retrospectively from the University of Rochester Department of Orthopaedics, in compliance with institutional review board research exemption. The tibial nonunion 4.5 mo after fracture is apparent from plain X-ray (A). The nonunion was confirmed by 3D reconstruction of the patient's CT as evidenced by the space between the proximal (white) and distal (blue) ends of the fracture (B), which yielded a union area (red) of 4.2 cm2 (C). The effects of teriparatide on fracture healing are shown by X-ray (D) and 3D CT (E and F) and were quantified as a 2.8-fold increase in union area.

References

    1. Brigman BE, Hornicek FJ, Gebhardt MC, Mankin HJ. Allografts about the knee in young patients with high-grade sarcoma. Clin Orthop Relat Res. 2004:232–239. - PubMed
    1. Mohler DG, Yaszay B, Hong R, Wera G. Intercalary tibial allografts following tumor resection: The role of fibular centralization. Orthopedics. 2003;26:631–637. - PubMed
    1. Hornicek FJ, Gebhardt MC, Tomford WW, Sorger JI, Zavatta M, Menzner JP, Mankin HJ. Factors affecting nonunion of the allograft-host junction. Clin Orthop Relat Res. 2001:87–98. - PubMed
    1. Wheeler DL, Enneking WF. Allograft bone decreases in strength in vivo over time. Clin Orthop Relat Res. 2005:36–42. - PubMed
    1. Tiyapatanaputi P, Rubery PT, Carmouche J, Schwarz EM, O'Keefe RJ, Zhang X. A novel murine segmental femoral graft model. J Orthop Res. 2004;22:1254–1260. - PubMed

Publication types