Review
. 2009 Mar;45(1 Suppl):S210-21.
doi: 10.1016/j.neuroimage.2008.10.061. Epub 2008 Nov 20.

Evaluating the consistency and specificity of neuroimaging data using meta-analysis

Affiliations
Review

Evaluating the consistency and specificity of neuroimaging data using meta-analysis

Tor D Wager et al. Neuroimage. 2009 Mar.

Abstract

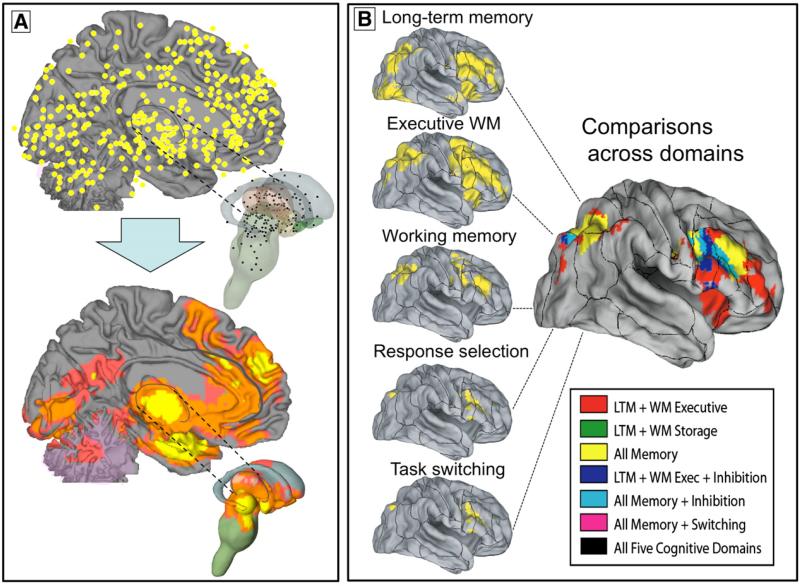
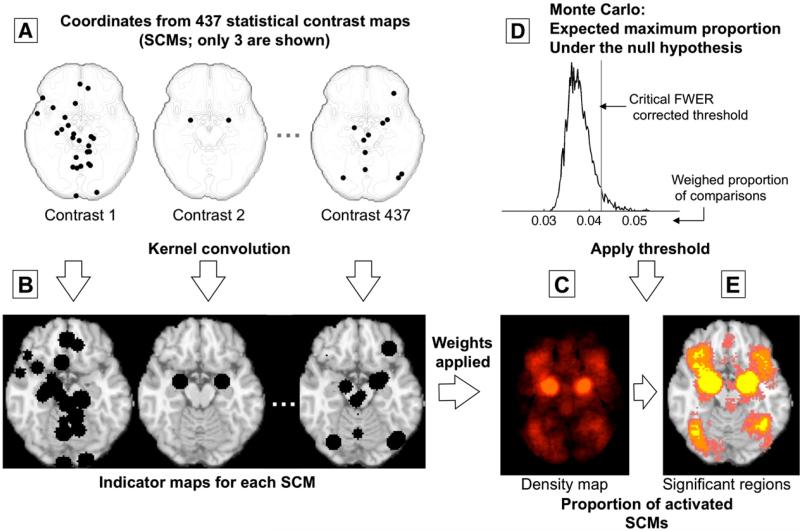
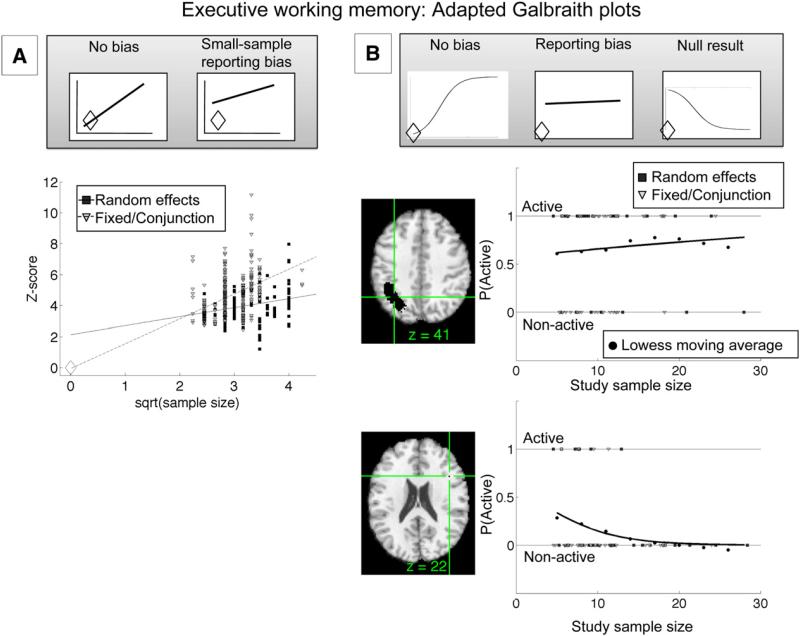
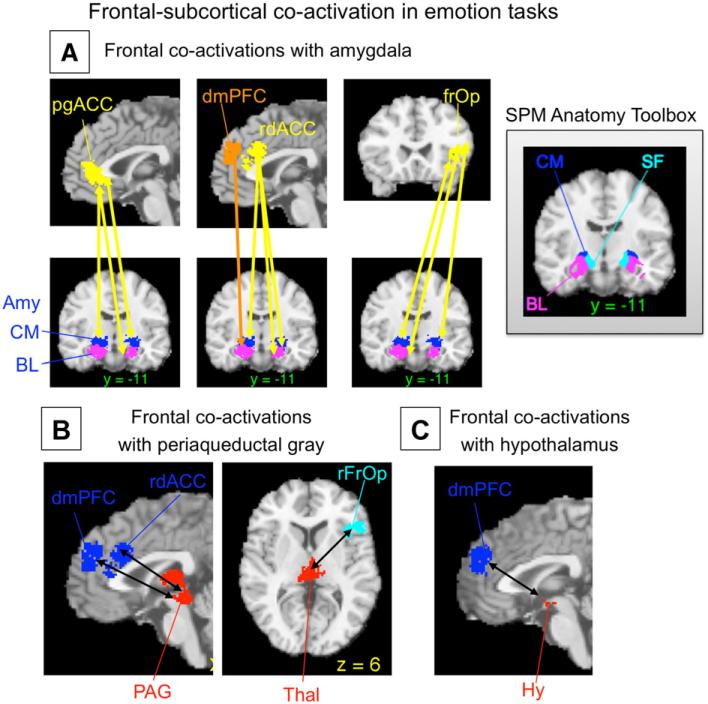
Making sense of a neuroimaging literature that is growing in scope and complexity will require increasingly sophisticated tools for synthesizing findings across studies. Meta-analysis of neuroimaging studies fills a unique niche in this process: It can be used to evaluate the consistency of findings across different laboratories and task variants, and it can be used to evaluate the specificity of findings in brain regions or networks to particular task types. This review discusses examples, implementation, and considerations when choosing meta-analytic techniques. It focuses on the multilevel kernel density analysis (MKDA) framework, which has been used in recent studies to evaluate consistency and specificity of regional activation, identify distributed functional networks from patterns of co-activation, and test hypotheses about functional cortical-subcortical pathways in healthy individuals and patients with mental disorders. Several tests of consistency and specificity are described.


Figures

Fig. 1
Fig. 1
Examples of results from multilevel kernel density analysis (MKDA). (A) Top panel: Peak activation coordinates from 437 study comparison maps (SCMs; from 163 studies) plotted on medial and subcortical brain surfaces (Wager et al., 2008). Peak locations within 12 mm from the SCM are averaged. Bottom panel: Summary of consistently activated regions across SCMs in the MKDA analysis. Yellow indicates a significant density of SCMs in a local neighborhood, and orange and pink indicate significant density using extent-based thresholding at primary thresholds of 0.001 and 0.01, respectively (see text for details). All results are family-wise error rate corrected at p<.05 for search across brain voxels. (B) MKDA results from five published meta-analyses of executive function mapped onto the PALS-B12 atlas (Van Essen, 2005) using Caret software, and the overlap in activations across the five types of executive function, from Van Snellenberg and Wager (in press). The results illustrate how meta-analysis can inform about common and differential activations across a variety of psychological processes.
Fig 2
Fig 2
Example procedures for multilevel kernel density analysis (MKDA). (Adapted from Wager et al. (2007), Fig. 3). (A) Peak coordinates of three of the 437 comparison maps included in a meta-analysis of emotion. Peak coordinates of each map are separately convolved with the kernel, generating (B) indicator maps for each study contrast map (SCM). (C) The weighted average of the indicator maps is compared with (D) the maximum proportion of activated comparison maps expected under the null hypothesis in a Monte Carlo simulation and (E) thresholded to produce a map of significant results. Color key is as in Fig. 1.
Fig. 3
Fig. 3
Adapted Galbraith plots illustrating application to meta-analysis. (A) Plot of Z-scores from available peaks from the executive working-memory (WM) vs. WM storage comparison of a published meta-analysis (Wager and Smith, 2003). Z-scores within significant regions in the multilevel kernel density analysis (MKDA; y-axis) are plotted against the square root of sample size (x-axis). In the absence of bias, the regression line should pass through the intercept (unfilled diamond). This condition holds for fixed-effects studies (light gray triangles), but not for random-effects studies (dark gray squares), indicating small-sample bias in the random-effects studies. See text for additional details. (B) Adapted Galbraith-style graph plotting activations for each study contrast map (SCM; y-axis) as a function of sample size (x-axis) within regions of interest from the MKDA analysis. Individual SCMs are plotted as points (1=active, 0=not active), and the solid regression line shows logistic regression fits for the proportion of activated SCMs (P(active), y-axis) as a function of sample size. The gray circles show estimates of P(active) using loess smoothing (λ=.75) and can be used to assess the quality of logistic regression fits. In the absence of bias, the logistic fit should pass through the intercept (see text). The upper plot shows results from a parietal region indicating some small-sample bias. The lower plot shows a small white-matter region in the frontal cortex. Activation was significantly consistent in the MKDA analysis, but the plot shows that it was driven entirely by the small-sample studies, suggesting a lack of true responses to executive WM in this region.
Fig. 4
Fig. 4
Example of co-activation analyses from a recent meta-analysis of emotion Adapted from Kober et al. (2008), Figs. 8–9). Co-activated regions show a significant tendency to be activated in the same study contrast maps (SCMs), as assessed with Kendall's tau-b. Arrows show significant co-activation. (A) Frontal regions (yellow/orange) co-activated with amygdala subregions (blue/purple) are a surprisingly circumscribed set of regions limited to the medial prefrontal cortex (mPFC) and the right ventrolateral PFC/frontal operculum. The inset shows regions from the SPM Anatomy Toolbox (V15; (Eickhoff, Heim, Zilles, and Amunts, 2006; Eickhoff et al., 2005). Amy, amygdala; BL, basolateral complex; CM, centromedial complex; dmPFC, dorsomedial prefrontal cortex; pgACC, pregenual anterior cingulate; rdACC, rostral dorsal anterior cingulate; rfrOp, right frontal operculum; SF, superficial amygdala. (B) Frontal regions co-activated with midbrain periaqueductal gray (red, shown including a contiguous region in the thalamus) include a subset of the same frontal regions. (C) The only frontal region co-activated with hypothalamus (red) was the dmPFC. These results suggest locations for functional frontal-limbic and frontal-brainstem pathways related to emotional experience that can be tested in future neuroimaging and lesion studies.

References

    1. Agresti A. Categorical Data Analysis. 2nd ed. John Wiley and Sons; Hoboken, NJ: 2002.
    1. An X, Bandler R, Ongur D, Price JL. Prefrontal cortical projections to longitudinal columns in the midbrain periaqueductal gray in macaque monkeys. J. Comp. Neurol. 1998;401(4):455–479. - PubMed
    1. Baas D, Aleman A, Kahn RS. Lateralization of amygdala activation: a systematic review of functional neuroimaging studies. Brains Res. Rev. 2004;45:96–103. - PubMed
    1. Brown S, Ingham RJ, Laird AR, Fox PT. Stuttered and fluent speech production: an ALE meta-analysis of functional neuroimaging studies. Hum. Brain Mapp. 2005;25:105–117. - PMC - PubMed
    1. Buchsbaum BR, Greer S, Chang W-L, Berman KF. Meta-analysis of neuroimaging studies of the Wisconsin Card-Sorting task. Hum. Brain Mapp. 2005;25:35–45. - PMC - PubMed

Publication types