

Estimating antiviral effectiveness against pandemic influenza using household data
- PMID: 19064345
- PMCID: PMC2839940
- DOI: 10.1098/rsif.2008.0404
Estimating antiviral effectiveness against pandemic influenza using household data
Abstract
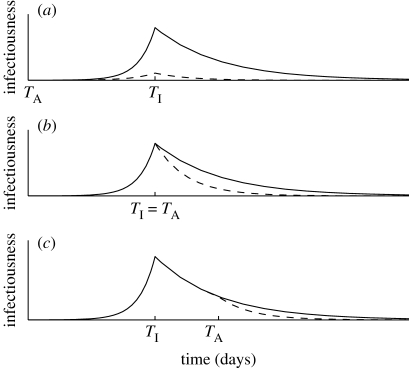
Current estimates of antiviral effectiveness for influenza are based on the existing strains of the virus. Should a pandemic strain emerge, strain-specific estimates will be required as early as possible to ensure that antiviral stockpiles are used optimally and to compare the benefits of using antivirals as prophylaxis or to treat cases. We present a method to measure antiviral effectiveness using early pandemic data on household outbreak sizes, including households that are provided with antivirals for prophylaxis and those provided with antivirals for treatment only. We can assess whether antiviral drugs have a significant impact on susceptibility or on infectivity with the data from approximately 200 to 500 households with a primary case. Fewer households will suffice if the data can be collected before case numbers become high, and estimates are more precise if the study includes data from prophylaxed households and households where no antivirals are provided. Rates of asymptomatic infection and the level of transmissibility of the virus do not affect the accuracy of these estimates greatly, but the pattern of infectivity in the individual strongly influences the estimate of the effect of antivirals on infectivity. An accurate characterization of the infectiousness profile--informed by strain-specific data--is essential for measuring antiviral effectiveness.
Figures
Similar articles
-
Can antiviral drugs contain pandemic influenza transmission?PLoS One. 2011 Mar 28;6(3):e17764. doi: 10.1371/journal.pone.0017764. PLoS One. 2011. PMID: 21464934 Free PMC article.
-
Antiviral stockpiles for influenza pandemics from the household perspective: treatment alone versus treatment with prophylaxis.Epidemics. 2013 Jun;5(2):92-7. doi: 10.1016/j.epidem.2012.11.001. Epub 2012 Nov 12. Epidemics. 2013. PMID: 23746802
-
Estimation of outbreak severity and transmissibility: Influenza A(H1N1)pdm09 in households.BMC Med. 2012 Oct 9;10:117. doi: 10.1186/1741-7015-10-117. BMC Med. 2012. PMID: 23046520 Free PMC article.
-
Antivirals in the management of an influenza pandemic.Med J Aust. 2006 Nov 20;185(S10):S58-61. doi: 10.5694/j.1326-5377.2006.tb00709.x. Med J Aust. 2006. PMID: 17115954 Review.
-
Potential benefits and limitations of various strategies to mitigate the impact of an influenza pandemic.J Infect Chemother. 2006 Aug;12(4):167-71. doi: 10.1007/s10156-006-0453-z. J Infect Chemother. 2006. PMID: 16944252 Free PMC article. Review.
Cited by
-
Household transmission of respiratory viruses - assessment of viral, individual and household characteristics in a population study of healthy Australian adults.BMC Infect Dis. 2012 Dec 11;12:345. doi: 10.1186/1471-2334-12-345. BMC Infect Dis. 2012. PMID: 23231698 Free PMC article.
-
Use of antiviral drugs to reduce household transmission of pandemic (H1N1) 2009, United Kingdom.Emerg Infect Dis. 2011 Jun;17(6):990-9. doi: 10.3201/eid/1706.101161. Emerg Infect Dis. 2011. PMID: 21749759 Free PMC article.
-
Transmission of novel influenza A(H1N1) in households with post-exposure antiviral prophylaxis.PLoS One. 2010 Jul 7;5(7):e11442. doi: 10.1371/journal.pone.0011442. PLoS One. 2010. PMID: 20628642 Free PMC article.
-
Using a Dynamic Model to Consider Optimal Antiviral Stockpile Size in the Face of Pandemic Influenza Uncertainty.PLoS One. 2013 Jun 21;8(6):e67253. doi: 10.1371/journal.pone.0067253. Print 2013. PLoS One. 2013. PMID: 23805303 Free PMC article.
-
Can antiviral drugs contain pandemic influenza transmission?PLoS One. 2011 Mar 28;6(3):e17764. doi: 10.1371/journal.pone.0017764. PLoS One. 2011. PMID: 21464934 Free PMC article.
References
-
- Bailey N.J.T.The mathematical theory of infectious diseases and its applications. 1975London, UK:Griffin
-
- Cheng M.H.2005Flu, what flu. Lancet Infect. Dis. 5, 746.10.1016/S1473-3099(05)70290-5. - DOI
Publication types
MeSH terms
Substances
LinkOut - more resources
Full Text Sources
Medical
