Corrective responses in human food intake identified from an analysis of 7-d food-intake records
- PMID: 19064509
- PMCID: PMC2747299
- DOI: 10.3945/ajcn.2008.26289
Corrective responses in human food intake identified from an analysis of 7-d food-intake records
Abstract
Background: We tested the hypothesis that ad libitum food intake shows corrective responses over periods of 1-5 d.
Design: This was a prospective study of food intake in women.
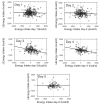
Methods: Two methods, a weighed food intake and a measured food intake, were used to determine daily nutrient intake during 2 wk in 20 women. Energy expenditure with the use of doubly labeled water was done contemporaneously with the weighed food-intake record. The daily deviations in macronutrient and energy intake from the average 7-d values were compared with the deviations observed 1, 2, 3, 4, and 5 d later to estimate the corrective responses.
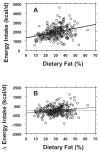
Results: Both methods of recording food intake gave similar patterns of macronutrient and total energy intakes and for deviations from average intakes. The intraindividual CVs for energy intake ranged from +/-12% to +/-47% with an average of +/-25%. Reported energy intake was 85.5-95.0% of total energy expenditure determined by doubly labeled water. Significant corrective responses were observed in food intakes with a 3- to 4-d lag that disappeared when data were randomized within each subject.
Conclusions: Human beings show corrective responses to deviations from average energy and macronutrient intakes with a lag time of 3-4 d, but not 1-2 d. This suggests that short-term studies may fail to recognize important signals of food-intake regulation that operate over several days. These corrective responses probably play a crucial role in bringing about weight stability.
Conflict of interest statement
None of the authors had a personal or financial conflict of interest.
Figures


References
-
- Blundell JE, Stubbs RJ. High and low carbohydrate and fat intakes: limits imposed by appetite and palatability; implications for energy balance. Eur J Clin Nutr. 1999;53(suppl 1):S148–65. - PubMed
-
- Campfield LA, Smith FJ. Blood glucose dynamics and control of meal initiation: a pattern detection and recognition theory. Physiol Rev. 2003;83:25–58. - PubMed
-
- Lewis SR, Dym C, Ginzberg M, Kest B, Bodnar RJ. Genetic variance contributes to ingestive processes: a survey of mercaptoacetate-induced feeding in eleven inbred and one outbred mouse strains. Physiol Behav. 2006;88:516–22. - PubMed
-
- Cummings DE, Weigle DS, Frayo RS, et al. Plasma ghrelin levels after diet-induced weight loss or gastric bypass surgery. N Engl J Med. 2002;346:1623–30. - PubMed
Publication types
MeSH terms
Substances
Grants and funding
LinkOut - more resources
Full Text Sources

