. 2008 Dec;17(12):3499-508.
doi: 10.1158/1055-9965.EPI-08-0482.

Whole-genome amplification enables accurate genotyping for microarray-based high-density single nucleotide polymorphism array

Affiliations

Whole-genome amplification enables accurate genotyping for microarray-based high-density single nucleotide polymorphism array

Farzana Jasmine et al. Cancer Epidemiol Biomarkers Prev. 2008 Dec.

Abstract

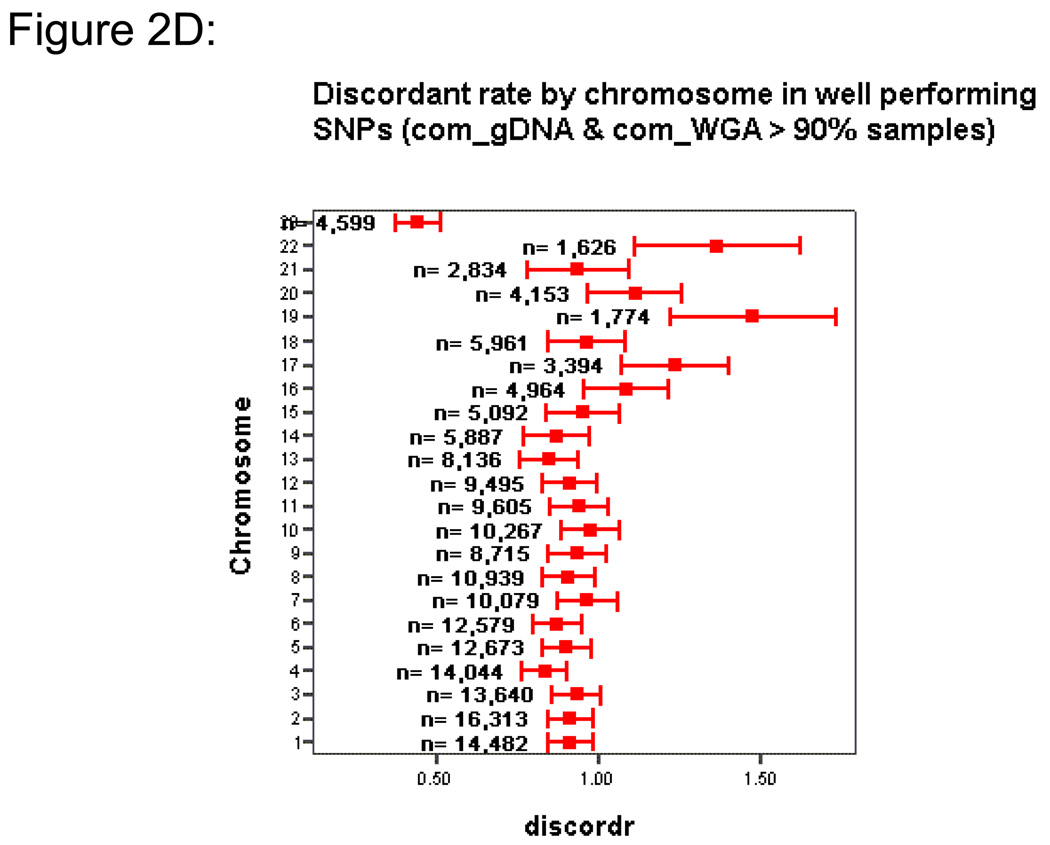
In large-scale genome-wide association studies based on high-density single nucleotide polymorphism (SNP) genotyping array, the quantity and quality of available genomic DNA (gDNA) is a practical problem. We examined the feasibility of using the Multiple Displacement Amplification (MDA) method of whole-genome amplification (WGA) for such a platform. The Affymetrix Early Access Mendel Nsp 250K GeneChip was used for genotyping 224,940 SNPs per sample for 28 DNA samples. We compared the call concordance using 14 gDNA samples and their corresponding 14 WGA samples. The overall mean genotype call rates in gDNA and the corresponding WGA samples were comparable at 97.07% [95% confidence interval (CI), 96.17-97.97] versus 97.77% (95% CI, 97.26-98.28; P = 0.154), respectively. Reproducibility of the platform, calculated as concordance in duplicate samples, was 99.45%. Overall genotypes for 97.74% (95% CI, 97.03-98.44) of SNPs were concordant between gDNA and WGA samples. When the analysis was restricted to well-performing SNPs (successful genotyping in gDNA and WGA in >90% of samples), 99.11% (95% CI, 98.80-99.42) of the SNPs, on average, were concordant, and overall a SNP showed a discordant call in 0.92% (95% CI, 0.90-0.94) of paired samples. In a pair of gDNA and WGA DNA, similar concordance was reproducible on Illumina's Infinium 610 Quad platform as well. Although copy number analysis revealed a total of seven small telomeric regions in six chromosomes with loss of copy number, the estimated genome representation was 99.29%. In conclusion, our study confirms that high-density oligonucleotide array-based genotyping can yield reproducible data and MDA-WGA DNA products can be effectively used for genome-wide SNP genotyping analysis.


Figures

Figure 1
Figure 1
Agilent 2100 BioAnalyzer electropherogram of 10 WGA DNA samples (normalized to 50 ng/ul concentration) overlaid on ladder marker peaks (shown in red). After the initial spike at 50 bp, the subsequent ladder peaks correspond to 100, 300, 500, 700, 1000, 1500, 2000, 3000, 5000, 7000, 10380 bp respectively. All the samples (in different color) show uniform smearing effect starting around 1500 bp extending to >10 kb size with clear peak around 7 kb region (11th peak).
Figure 2
Figure 2
(A) X axis represents the mean (95% CI) completeness of genotype call in gDNA samples (blue solid square) and WGA samples (red open square) and Y axis represents chromosomes. Chromosome X is represented by chromosome 23. The error bars represent 95% confidence intervals. (B) Genotype concordance rate in all samples combined and samples from different centers. The error bar represents SD. (C) Discordant rate (on Y axis) is shown as a function of completeness of genotyping in WGA samples (on X axis). The number of SNPs in each group is also shown. The error bar represents 95% CI. (D) For the well performing SNPs (those which could be successfully genotyped in > 90% of the cases in both gDNA and WGA samples) discordant rate is shown in different chromosomes. Total number of SNPs in each chromosome is also shown. The error bar represents 95% CI.
Figure 2
Figure 2
(A) X axis represents the mean (95% CI) completeness of genotype call in gDNA samples (blue solid square) and WGA samples (red open square) and Y axis represents chromosomes. Chromosome X is represented by chromosome 23. The error bars represent 95% confidence intervals. (B) Genotype concordance rate in all samples combined and samples from different centers. The error bar represents SD. (C) Discordant rate (on Y axis) is shown as a function of completeness of genotyping in WGA samples (on X axis). The number of SNPs in each group is also shown. The error bar represents 95% CI. (D) For the well performing SNPs (those which could be successfully genotyped in > 90% of the cases in both gDNA and WGA samples) discordant rate is shown in different chromosomes. Total number of SNPs in each chromosome is also shown. The error bar represents 95% CI.
Figure 3
Figure 3
Upper panel shows graphical representation of the genome-wide copy number (CN) change regions. Blue regions indicate loss of copy number in WGA samples compared to the corresponding gDNA samples. No region was identified as gain of copy number. The lower panel shows the chromosomal location, length, average CN, the CNV variation ID# from the database of genomic variants and number of SNPs in those CN loss regions shown in the upper panel.
Figure 4
Figure 4
(A) Detailed view of CN changes detected in all the 14 WGA samples in chromosome 9. The upper panel indicates the copy number loss regions marked by blue, the middle panel shows the plot of estimated copy number in reference to the gDNA samples and the lower panel represents the heat map of all the 14 WGA samples (each row represents a WGA sample) where blue indicates loss of copy number, grey normal copy number and the red gain in copy number. The 8 samples with loss of CN are highlighted in black box in the lower panel. The cytoband regions of chromosome 9 are also shown at the bottom of the lower panel. (B) Genome browser view from the Database of Genomic Variants for the copy number loss region of chromosome 9q34.2, q34.3 region (130M to 140M) shown in figure 4A. The cytoband regions are shown in dark gray, the CNVs reported in the publicly available DGV database are shown in orange and the Insertion-Deletions (InDels) between 100 bp and 1kb size are shown in green.
Figure 4
Figure 4
(A) Detailed view of CN changes detected in all the 14 WGA samples in chromosome 9. The upper panel indicates the copy number loss regions marked by blue, the middle panel shows the plot of estimated copy number in reference to the gDNA samples and the lower panel represents the heat map of all the 14 WGA samples (each row represents a WGA sample) where blue indicates loss of copy number, grey normal copy number and the red gain in copy number. The 8 samples with loss of CN are highlighted in black box in the lower panel. The cytoband regions of chromosome 9 are also shown at the bottom of the lower panel. (B) Genome browser view from the Database of Genomic Variants for the copy number loss region of chromosome 9q34.2, q34.3 region (130M to 140M) shown in figure 4A. The cytoband regions are shown in dark gray, the CNVs reported in the publicly available DGV database are shown in orange and the Insertion-Deletions (InDels) between 100 bp and 1kb size are shown in green.
Figure 5
Figure 5
(A) Completeness of genotyping of group-I SNPs (those in cytobands with loss of CN) and group-II SNPs (in cytobands with normal CN) by chromosome in WGA samples. (B) Discordant rate of group-I SNPs (those in cytobands with loss of CN in WGA samples) and group-II SNPs (in cytobands with normal CN in WGA samples) by chromosome.
Figure 5
Figure 5
(A) Completeness of genotyping of group-I SNPs (those in cytobands with loss of CN) and group-II SNPs (in cytobands with normal CN) by chromosome in WGA samples. (B) Discordant rate of group-I SNPs (those in cytobands with loss of CN in WGA samples) and group-II SNPs (in cytobands with normal CN in WGA samples) by chromosome.
Figure 6
Figure 6. Genotyping for rs1476413 using Fluorescent Polarization method for g-DNA samples (left) and corresponding WGA-DNA samples (right)
Genotyping from gDNA and corresponding WGA DNA for rs1476413 using Fluorescent Polarization method (a single base extension method). Clustering of 84 genotype calls, using 25 ng of gDNA in left panel and 25 ng of corresponding WGA-DNA (from stock of WGA obtained from 25 ng of g-DNA input in WGA reaction) on the right panel. SNP concordance was 100%.

References

    1. Hosono S, Faruqi AF, Dean FB, et al. Unbiased whole-genome amplification directly from clinical samples. Genome Res. 2003;13:954–964. - PMC - PubMed
    1. Harty LC, Garcia-Closas M, Rothman N, Reid YA, Tucker MA, Hartge P. Collection of buccal cell DNA using treated cards. Cancer Epidemiol Biomarkers Prev. 2000;9:501–506. - PubMed
    1. Packer RJ, Bolton BJ. A Laboratory Handbook: Immortalization of B-Lymphocyte by Epstein-Barr Virus. Academic Press; 1998. Cell Biology.
    1. Cheung VG, Nelson SF. Whole genome amplification using a degenerate oligonucleotide primer allows hundreds of genotypes to be performed on less than one nanogram of genomic DNA. Proc Natl Acad Sci U S A. 1996;93:14676–14679. - PMC - PubMed
    1. Little SE, Vuononvirta R, Reis-Filho JS, et al. Array CGH using whole genome amplification of fresh-frozen and formalin-fixed, paraffin-embedded tumor DNA. Genomics. 2006;87:298–306. - PubMed

Publication types