. 2008 Dec 22;205(13):3201-13.
doi: 10.1084/jem.20080552. Epub 2008 Dec 8.

An essential role for the MAL protein in targeting Lck to the plasma membrane of human T lymphocytes

Affiliations

An essential role for the MAL protein in targeting Lck to the plasma membrane of human T lymphocytes

Olga Antón et al. J Exp Med. .

Abstract

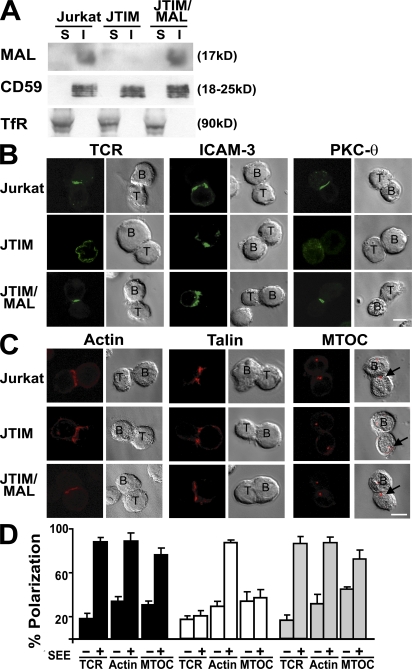
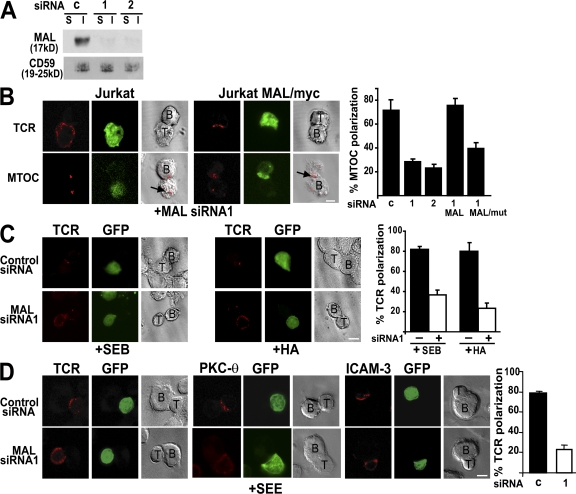
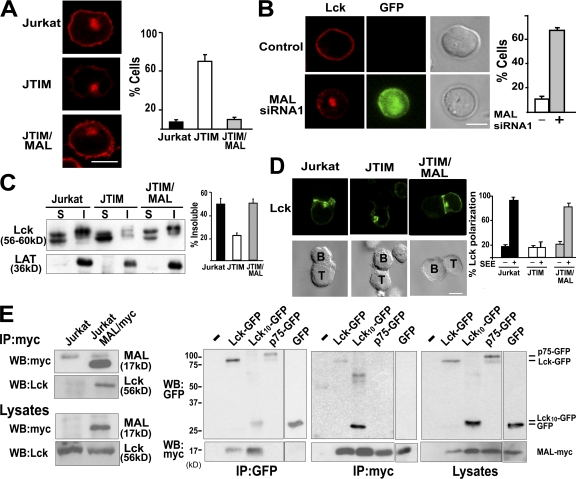
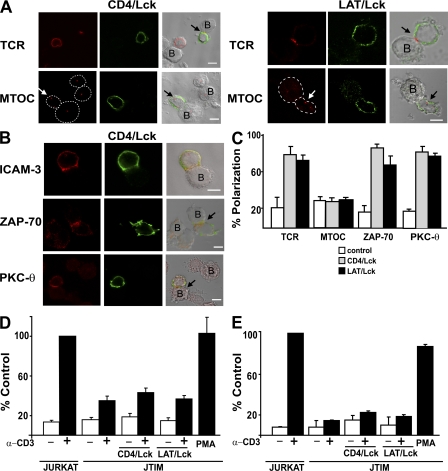
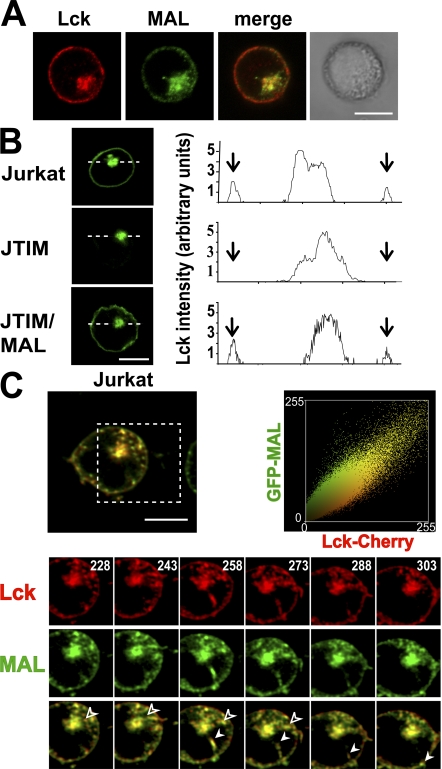
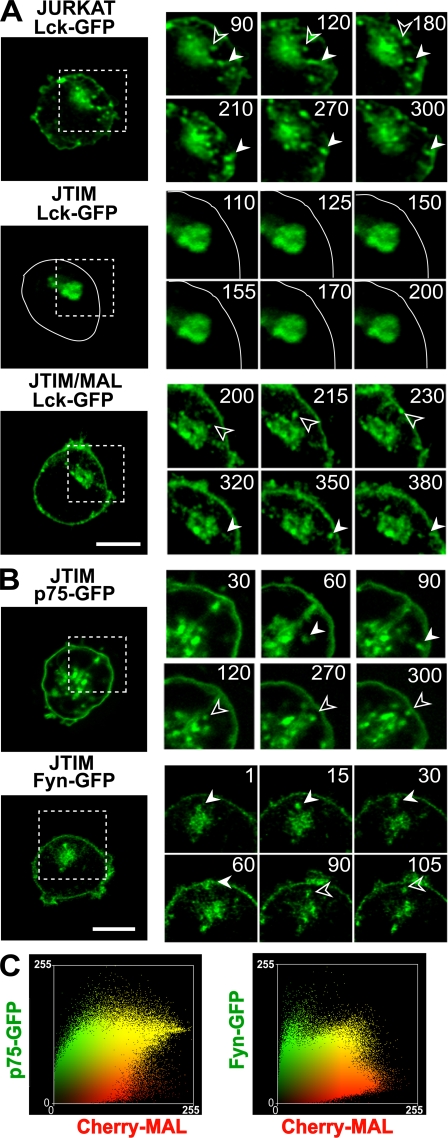
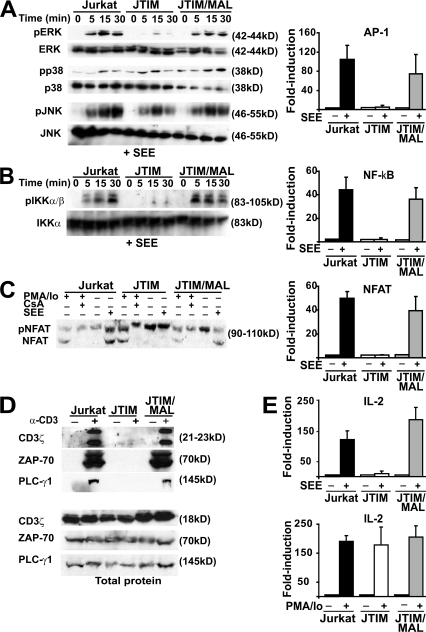
The MAL protein is an essential component of the specialized machinery for apical targeting in epithelial cells. The src family kinase Lck plays a pivotal role in T cell signaling. We show that MAL is required in T cells for efficient expression of Lck at the plasma membrane and activation of IL-2 transcription. To investigate the mechanism by which MAL regulates Lck targeting, we analyzed the dynamics of Lck and found that it travels to the plasma membrane in specific transport carriers containing MAL. Coimmunoprecipitation experiments indicated an association of MAL with Lck. Both carrier formation and partitioning of Lck into detergent-insoluble membranes were ablated in the absence of MAL. Polarization of T cell receptor for antigen (TCR) and microtubule-organizing center to immunological synapse (IS) were also defective. Although partial correction of the latter defects was possible by forced expression of Lck at the plasma membrane, their complete correction, formation of transport vesicles, partitioning of Lck, and restoration of signaling pathways, which are required for IL-2 transcription up-regulation, were achieved by exogenous expression of MAL. We concluded that MAL is required for recruitment of Lck to specialized membranes and formation of specific transport carriers for Lck targeting. This novel transport pathway is crucial for TCR-mediated signaling and IS assembly.


Figures

Figure 1.
Figure 1.
MAL expression is required for translocation of TCR and reorientation of MTOC to IS. (A) Normal Jurkat cells, JTIM cells, and JTIM/MAL cells were extracted with 1% Triton X-100 at 4°C. The soluble (S) and insoluble (I) fractions were isolated by centrifugation to equilibrium in sucrose density gradients. Equivalent aliquots from both fractions were analyzed by immunoblotting with anti-MAL mAb 6D9. The distributions of CD59 and TfR, as respective markers of the insoluble and soluble fractions, were analyzed as a control of the fractionation procedure. (B and C) Cells were conjugated to SEE-pulsed APCs for 15 min. After cell fixation, the distribution of TCR, ICAM-3, and PKC-θ (B) and that of actin, talin, and γ-tubulin (C) were analyzed in nonpermeabilized or permeabilized cells, respectively. The arrows indicate the position of the MTOC in the T cell. (D) The mean percentage ± SEM of Jurkat cells in T cell–APC conjugates with polarized distribution of TCR, actin, and MTOC to the IS was quantified in three independent experiments. n > 100 T cells/experiment (right). Bars, 5 μm.
Figure 2.
Figure 2.
Effect of MAL knockdown on IS formation in Jurkat cells and primary T lymphocytes. (A) Jurkat cells were transfected with DNA constructs expressing GFP and a control (c) siRNA or the indicated MAL siRNA and incubated for 48 h at 37°C. GFP-expressing cells were separated in a cell sorter and analyzed for MAL expression by immunoblotting with anti-MAL mAb 6D9. (B) Normal Jurkat cells or Jurkat cells stably expressing either MAL/myc or MALmut/myc were transfected with pMAL-siRNA1/GFP or pMAL-siRNA2/GFP, as indicated. After 48 h at 37°C, cells were conjugated to SEE-loaded Raji cells for 20 min and fixed. The distribution of TCR and MTOC was determined by immunofluorescence analysis. The arrows indicate the position of the MTOC in the T cell. A quantitative analysis of the effect of MAL siRNA expression on MTOC reorientation is shown in the histogram. (C) Jurkat CH7C17 cells expressing GFP and a control siRNA or MAL siRNA1 for 48 h at 37°C were conjugated to either SEB or HA peptide–loaded HOM2 cells for 20 min and fixed. The distribution of TCR was determined by immunofluorescence analysis. (D) Human PBLs were transfected with plasmid DNA expressing GFP and a control siRNA or MAL siRNA1 and incubated for 36 h at 37°C. Cells were then conjugated to SEE-loaded APCs for 15 min. After cell fixation, the distribution of TCR, PKC-θ, and ICAM-3 was determined by immunofluorescence analysis. The histograms show the mean ± SEM of the percentage of APC-conjugated GFP-expressing T cells with MTOC (B) or TCR (C and D) polarized to the IS. Three independent experiments were performed. n > 100 T cells/experiment. Bars, 5 μm.
Figure 3.
Figure 3.
MAL is required for the targeting of Lck to the plasma membrane. (A) The subcellular distribution of endogenous Lck was analyzed by indirect immunofluorescence in the three types of Jurkat cell. The percentage of cells with low levels of peripheral Lck are shown on the right and measured as described in Materials and methods. (B) Human PBLs were transfected with plasmid DNA expressing GFP and MAL siRNA1 and incubated for 36 h at 37°C. After cell fixation, the distribution of Lck was determined by immunofluorescence analysis in three independent experiments. n > 100 T cells/experiment. The histograms represent the mean percentage ± SEM of cells with predominant intracellular localization of Lck. (C) The soluble (S) and insoluble (I) membrane fractions of resting normal Jurkat cells, JTIM cells, and JTIM/MAL cells were isolated by centrifugation to equilibrium. Equivalent aliquots from both fractions were then analyzed by immunoblotting to detect endogenous Lck and LAT. The histogram represents the mean percentage ± SEM of Lck into the membrane insoluble fraction. Three independent experiments were performed. (D) Cells were conjugated to SEE-pulsed APCs for 15 min. After cell fixation, the distribution of Lck was analyzed. The histogram represents the mean percentage of Jurkat cells in T cell–APC conjugates with polarized distribution of Lck to the IS as quantified in three independent experiments. n > 100 T cells/experiment. (E) Lysates of normal Jurkat cells or Jurkat cells stably expressing MAL/myc cells were immunoprecipitated with anti-myc mAb, and the immunoprecipitates and the original lysates were analyzed by immunoblotting with antibodies to the c-myc tag or to Lck as indicated (left). Normal COS-7 cells or COS-7 cells transiently coexpressing MAL/myc and Lck-GFP, Lck10-GFP, p75-GFP, or GFP were lysed and immunoprecipitated with anti-myc or GFP antibodies. The immunoprecipitates and the original lysates were finally analyzed by immunoblot with anti-myc and anti-GFP antibodies as indicated (right). Bars, 5 μm.
Figure 4.
Figure 4.
Forced expression of Lck at the plasma membrane in MAL-deficient cells corrects TCR targeting to the IS. JTIM cells were transfected with the CD4/Lck or the LAT/Lck plasmids. After 48 h at 37°C, cells were conjugated to SEE-loaded Raji cells for 20 min and fixed. Transfected cells were detected with antibodies to mouse CD4 or to the c-Myc tag to detect expression of the CD4/Lck or LAT/Lck chimeras, respectively. (A) The distribution of TCR and MTOC was determined by immunofluorescence analysis. In the case of MTOC analysis, the contour of the cells has been drawn with a dotted line to facilitate the identification of the cells. The arrows indicate the position of the TCR or MTOC in the T cells expressing the chimera. (B) The distribution of ICAM-3, ZAP-70, and PKC-θ was determined by immunofluorescence analysis. Conjugates in A and B formed by untransfected JTIM cells serve as internal controls. Bars, 5 μm. (C) Quantitative analysis of the polarization of TCR, MTOC, ZAP-70, and PKC-θ in JTIM cells expressing the CD4/Lck or LAT Lck chimeras. Three independent experiments were performed. n > 100 T cells/experiment. The histogram shows the mean percentage ± SEM of APC conjugates with TCR, MTOC, ZAP-70, or PKC-θ polarized to the IS. (D and E) Jurkat cells and JTIM cells transfected or not with the CD4/Lck or LAT/Lck chimeras were transfected with CD4ΔCyt-GFP (D) or pEGFP-C1 (E) and treated with activating anti-CD3 antibodies or PMA as indicated. After 15 min (D) or 16 h (E) at 37°C, EGFP-expressing cells were analyzed for phosphorylated Erk (D) or CD69 (E) expression by flow cytometry. The cotransfection efficiency was >80% as determined by immunofluorescence microscopy. The histograms shows the percentage ± SEM of the mean fluorescence of phospho-Erk and CD69 obtained in each case relative to that of Jurkat cells stimulated with anti-CD3 antibodies. Three independent experiments were performed.
Figure 5.
Figure 5.
Lck and MAL travel in the same transport vesicles destined for the plasma membrane. (A) Jurkat cells stably expressing GFP-MAL were subjected to double label immunofluorescence analysis to detect GFP-MAL and endogenous Lck. (B) Cells were transfected with Lck-GFP and the distribution of Lck-GFP was analyzed 20 h later. A densitometric analysis of the distribution of Lck-GFP along the line in each type of cell is shown on the right panels. Arrows indicate the position of the periphery of the cell. (C) Jurkat cells stably expressing GFP-MAL were transiently transfected with plasmid DNA expressing Lck-Cherry and subjected to time-lapse videomicroscopy. The processes occurring within the region indicated by the dashed square are shown at higher magnification in the bottom panels. Solid and empty arrowheads indicate two vesicles transporting MAL and Lck together to the plasma membrane. Numbers indicate time in seconds. The plot on the right shows a high correlation of the colocalization of MAL and Lck throughout the time-lapse experiment (Pearson's correlation coefficient = 0.945).
Figure 6.
Figure 6.
MAL is required for formation of vesicles transporting Lck to the plasma membrane. (A) WT Jurkat cells, JTIM cells, or JTIM/MAL cells were transiently transfected with plasmid DNA expressing Lck-GFP and monitored by time-lapse videomicroscopy to detect the formation of Lck-containing transport vesicles. The contour of the JTIM cell transfected with Lck-GFP has been drawn with a continuous line to indicate the position of the plasma membrane. (B) A similar analysis was done in JTIM cells transiently expressing p75-GFP and Fyn-GFP. The processes occurring within the regions indicated by the dashed squares are shown at higher magnification on the right. Filled and empty arrowheads indicate vesicles transporting Lck, p75, or Fyn. Numbers indicate time in seconds. Bars, 5 μm. (C) Jurkat cells stably expressing Cherry-MAL were transiently transfected with plasmid DNA expressing p75-GFP or Fyn-GFP and subjected to time-lapse videomicroscopy. Colocalization plots of MAL and p75 or Fyn throughout the time-lapse experiment are shown. Pearson's correlation coefficients were 0.710 and 0.752 for MAL/p75 and MAL/Fyn, respectively.
Figure 7.
Figure 7.
Signaling pathways of Jurkat cells leading to activation of AP-1, NF-κB, and NFAT and to induced tyrosine phosphorylation are dependent on MAL expression. (A) The three types of Jurkat cell were conjugated to APCs pulsed with SEE for the indicated times. Cell extracts were analyzed by immunoblotting to detect the activated, phosphorylated (p) forms or the total content of Erk, p38, and JNK as indicated (left). Cells were transfected with a luciferase reporter plasmid whose transcription was controlled by AP-1. Cells were then conjugated to APCs, which were pulsed or not with SEE. After 4 h, luciferase activity was measured (right). (B) The three types of Jurkat cell were conjugated for the indicated times to APCs pulsed with SEE. Cell extracts were analyzed by immunoblotting to detect the activated phosphorylated forms of IKK-α/β or the total content of IKK-α (left). Cells were transfected with a luciferase reporter plasmid whose transcription was controlled by NF-κB. Cells were then conjugated to APCs, which were pulsed or not with SEE. After 4 h, luciferase activity was measured (right). (C) Cells were conjugated to APCs pulsed with SEE for 1 h at 37°C. Cell extracts were analyzed by immunoblotting with anti-NFAT antibodies that detect both the inactive phosphorylated NFAT and the active dephosphorylated NFAT forms. Control of cells treated for 1 h with PMA plus ionomycin (Io) in the absence or presence of cyclosporin A (CsA) was included to help identification of phosphorylated and dephosphorylated NFAT (left). The three types of Jurkat cell were transfected with a luciferase reporter plasmid whose transcription was controlled by NFAT. Cells were then conjugated to APCs, which were pulsed or not with SEE. After 4 h, luciferase activity was measured (right). (D) Cells were treated or not with activating anti-CD3 UCHT1 antibodies for 15 min. Cell extracts were immunoprecipitated with antiphosphotyrosine PY20 mAb coupled to agarose. The phosphotyrosine immunoprecipitates were immunoblotted to detect tyrosine phosphorylated CD3ζ, ZAP-70, and PLC-γ1 (top). The original extracts were immunoblotted to show the total content of CD3ζ, ZAP-70, and PLC-γ1 (bottom). (E) The three types of Jurkat cell were transiently transfected with plasmid DNA containing the luciferase gene under the control of the IL-2 promoter. After 16 h, cells were conjugated to APCs, which were pulsed or not with SEE (top), or incubated or not with PMA plus ionomycin (Io; bottom). After 4 h, cell extracts were used to determine luciferase activity. Data are represented as mean ± SEM of the luciferase activity in stimulated cells relative to that in unstimulated cells.

References

    1. Lin, J., and A. Weiss. 2001. T cell receptor signalling. J. Cell Sci. 114:243–244. - PubMed
    1. Karnitz, L., S.L. Sutor, T. Torigoe, J.C. Reed, M.P. Bell, D.J. McKean, P.J. Leibson, and R.T. Abraham. 1992. Effects of p56lck deficiency on the growth and cytolytic effector function of an interleukin-2-dependent cytotoxic T-cell line. Mol. Cell. Biol. 12:4521–4530. - PMC - PubMed
    1. Straus, D.B., and A. Weiss. 1992. Genetic evidence for the involvement of the lck tyrosine kinase in signal transduction through the T cell antigen receptor. Cell. 70:585–593. - PubMed
    1. Ley, S.C., M. Marsh, C.R. Bebbington, K. Proudfoot, and P. Jordan. 1994. Distinct intracellular localization of Lck and Fyn protein tyrosine kinases in human T lymphocytes. J. Cell Biol. 125:639–649. - PMC - PubMed
    1. Shenoy-Scaria, A.M., L.K. Gauen, J. Kwong, A.S. Shaw, and D.M. Lublin. 1993. Palmitylation of an amino-terminal cysteine motif of protein tyrosine kinases p56lck and p59fyn mediates interaction with glycosyl-phosphatidylinositol-anchored proteins. Mol. Cell. Biol. 13:6385–6392. - PMC - PubMed

Publication types

MeSH terms