. 2008 Dec 16;105(50):19732-7.
doi: 10.1073/pnas.0810057105. Epub 2008 Dec 8.

Analysis of cryo-electron microscopy images does not support the existence of 30-nm chromatin fibers in mitotic chromosomes in situ

Affiliations

Analysis of cryo-electron microscopy images does not support the existence of 30-nm chromatin fibers in mitotic chromosomes in situ

Mikhail Eltsov et al. Proc Natl Acad Sci U S A. .

Abstract

Although the formation of 30-nm chromatin fibers is thought to be the most basic event of chromatin compaction, it remains controversial because high-resolution imaging of chromatin in living eukaryotic cells had not been possible until now. Cryo-electron microscopy of vitreous sections is a relatively new technique, which enables direct high-resolution observation of the cell structures in a close-to-native state. We used cryo-electron microscopy and image processing to further investigate the presence of 30-nm chromatin fibers in human mitotic chromosomes. HeLa S3 cells were vitrified by high-pressure freezing, thin-sectioned, and then imaged under the cryo-electron microscope without any further chemical treatment or staining. For an unambiguous interpretation of the images, the effects of the contrast transfer function were computationally corrected. The mitotic chromosomes of the HeLa S3 cells appeared as compact structures with a homogeneous grainy texture, in which there were no visible 30-nm fibers. Power spectra of the chromosome images also gave no indication of 30-nm chromatin folding. These results, together with our observations of the effects of chromosome swelling, strongly suggest that, within the bulk of compact metaphase chromosomes, the nucleosomal fiber does not undergo 30-nm folding, but exists in a highly disordered and interdigitated state, which is, on the local scale, comparable with a polymer melt.


Conflict of interest statement

The authors declare no conflict of interest.

Figures

Fig. 1.
Fig. 1.
Cryo-EM view of a vitreous section of a mitotic HeLa S3 cell. Chromosomes are recognized by their elongated aspect and uniform texture. Numerous granules, membrane cisterns (mc), vesicles, and mitochondria (m) are evident in the cytoplasm, which is bordered by the cytoplasmic membrane (cm). Oblique striations of the image intensity are the result of knife marks during the sectioning process. A surface contamination with hexagonal ice (h) is also seen. The section thickness is ≈60 nm. (Scale bar, 1 μm.)
Fig. 2.
Fig. 2.
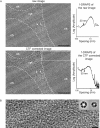
The characteristic grainy texture of the chromosome is maintained after CTF correction. (A) An area of a mitotic HeLa S3 cell section that contains 3 parts of chromosomes (outlined in white) separated by the cytoplasm, is shown before and after CTF correction. The corresponding 1-DRAPS shown on the right side. The amplitudes are plotted as arbitrary units by using logarithmic scale on the y axis. The y axis units are the same in both plots. (B) A magnified segment of the CTF-corrected chromosomal texture. The inset in B shows simulated top views of 30-nm fibers assembled the interdigitated solenoid (left inset) (22), and 2-start helix (right inset) (27). The simulation was low-pass filtered to make it compatible with the CTF-corrected image of the chromosome. (Scale bars, 200 nm in A and 30 nm in B.)
Fig. 3.
Fig. 3.
Averaged 1-DRAPS of chromosomes (red) and cytoplasm (blue) after CTF correction reveals characteristic spacing peaks. Two ranges of spacing are shown: from 7 to 30 nm (A) and from 20 to 100 nm (B). A broad peak of spacing with a maximum of ≈11.3 nm is observed for the chromosomes, whereas no peaks within this range are detected for the cytoplasm. In the 20–80 nm range, the chromosomal texture shows no spacing peaks. In contrast, a peak with maximum at ≈30 nm is detected in the cytoplasm.
Fig. 4.
Fig. 4.
Swelling of isolated mitotic HeLa S3 chromosomes in vitro by decreasing the Mg2+ concentration. The vertical columns of the images show the appearance of chromosomes at the corresponding Mg2+ concentration in the swelling buffer. Each column contains a cryo-EM image of the vitreous section taken at low magnification (LM), high magnification (HM), and the averaged CTF-corrected 1-DRAPS for the spacing range of 8–30 nm. Note that the texture of isolated chromosome in 5 mM Mg2+ is very similar to that of native chromosomes observed in the mitotic cell section (see Fig. 2) and is consistently characterized by a spacing peak with maximum at ≈11 nm. Also noteworthy is the gradual shift of this spacing peak that accompanies the gradual swelling of the chromosomes with decreasing Mg2+ concentration. Complete removal of Mg2+ by EDTA results in fully decompacted chromatin fibers and loss of the spacing peak in the observed range (1 mM EDTA). [Scale bars, 100 nm (LM) and 30 nm (HM).]
Fig. 5.
Fig. 5.
The melt model of mitotic chromosome structure. Under diluted conditions, the flexible nucleosomal fibers may compact through selective close neighbor associations, thus forming the 30-nm chromatin fibers. An increase in chromatin concentration results in interfiber nucleosomal contacts, which interfere with the intrafiber bonds. Nucleosomes of adjacent fibers interdigitate and intermix. The 30-nm folding is disrupted and the nucleosomal fibers melt into a uniform mass. Because there is no difference between the intrafiber and interfiber nucleosome affinities, the nucleosomal filaments return to the open disordered conformation of the diluted state before compaction. Note that the chromatin compaction events are linked to the sequence in the figure to better illustrate the principle of the melt formation. The actual compaction pathway leading to the chromatin melt in vivo is unknown.

Comment in

Similar articles

Cited by

References

    1. Becker WM, Reece JB, Poenie MF. In: The World of the Cell. Becker WM, editor. Menlo Park, CA: Benjamin-Cummings Publishing Company; 1996. pp. 434–435.
    1. Kornberg RD. Chromatin structure: A repeating unit of histones and DNA. Science. 1974;184:868–871. - PubMed
    1. Oudet P, Gross-Bellard M, Chambon P. Electron microscopic and biochemical evidence that chromatin structure is a repeating unit. Cell. 1975;4:281–300. - PubMed
    1. Kornberg RD, Lorch Y. Twenty-five years of the nucleosome, fundamental particle of the eukaryote chromosome. Cell. 1999;98:285–294. - PubMed
    1. Swedlow JR, Hirano T. The making of the mitotic chromosome: Modern insights into classical questions. Mol Cell. 2003;11:557–569. - PubMed

Publication types