. 2009 Jan;119(1):80-90.
doi: 10.1172/JCI35772. Epub 2008 Dec 8.

Expression of an activating mutation in the gene encoding the KATP channel subunit Kir6.2 in mouse pancreatic beta cells recapitulates neonatal diabetes

Affiliations

Expression of an activating mutation in the gene encoding the KATP channel subunit Kir6.2 in mouse pancreatic beta cells recapitulates neonatal diabetes

Christophe A Girard et al. J Clin Invest. 2009 Jan.

Abstract

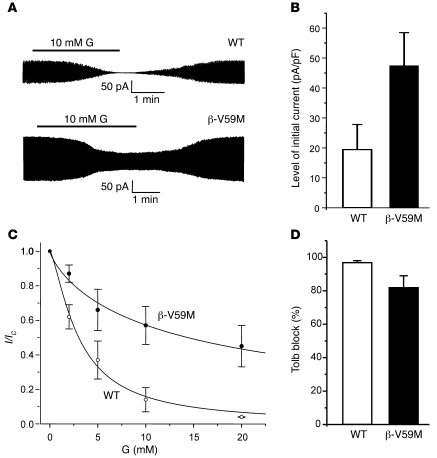
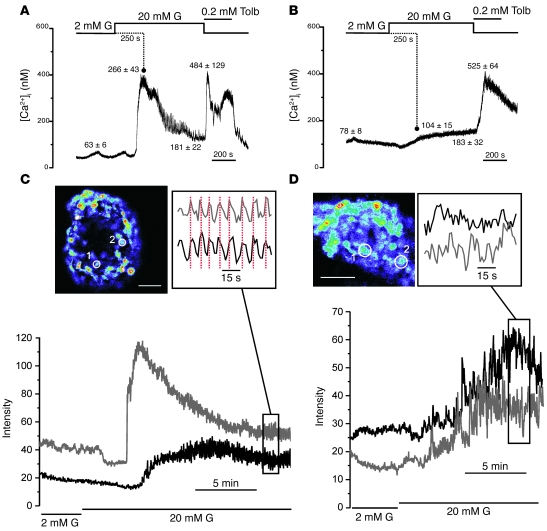
Neonatal diabetes is a rare monogenic form of diabetes that usually presents within the first six months of life. It is commonly caused by gain-of-function mutations in the genes encoding the Kir6.2 and SUR1 subunits of the plasmalemmal ATP-sensitive K+ (KATP) channel. To better understand this disease, we generated a mouse expressing a Kir6.2 mutation (V59M) that causes neonatal diabetes in humans and we used Cre-lox technology to express the mutation specifically in pancreatic beta cells. These beta-V59M mice developed severe diabetes soon after birth, and by 5 weeks of age, blood glucose levels were markedly increased and insulin was undetectable. Islets isolated from beta-V59M mice secreted substantially less insulin and showed a smaller increase in intracellular calcium in response to glucose. This was due to a reduced sensitivity of KATP channels in pancreatic beta cells to inhibition by ATP or glucose. In contrast, the sulfonylurea tolbutamide, a specific blocker of KATP channels, closed KATP channels, elevated intracellular calcium levels, and stimulated insulin release in beta-V59M beta cells, indicating that events downstream of KATP channel closure remained intact. Expression of the V59M Kir6.2 mutation in pancreatic beta cells alone is thus sufficient to recapitulate the neonatal diabetes observed in humans. beta-V59M islets also displayed a reduced percentage of beta cells, abnormal morphology, lower insulin content, and decreased expression of Kir6.2, SUR1, and insulin mRNA. All these changes are expected to contribute to the diabetes of beta-V59M mice. Their cause requires further investigation.


Figures

Figure 1
Figure 1. Generation and identification of transgenic mice.
(A and B) Targeting strategy. Insertion of the targeting vector ROSA26-STOP-Kir6.2V59M (B) into the ROSA26 locus (A) by homologous recombination in mouse ES cells. (C) Targeted ROSA locus. (D) After Cre-mediated deletion of the STOP cassette, Kir6.2-V59M is expressed under the control of the endogenous ROSA26 promoter. 1–3, ROSA26 exons 1–3; SA, splice acceptor signal; PGK-Neo, neomycin resistance gene; STOP, transcriptional STOP signal; DT-A, diphtheria toxin A; pA, polyadenylation signal; E, EcoRI restriction site; P, PacI restriction site; FRT, flippase recombinase target site. (E) Southern blot analysis of targeted ES clones. Genomic DNA from G418-resistant or WT ES clones was digested with EcoRI and probed with a 5′ external ROSA probe (location indicated in A) to confirm targeting of the ROSA26 locus. In contrast with WT ES cells, the recombinant ES clone shows a 5.1-kb band expected from the targeted ROSA26 allele.
Figure 2
Figure 2. β-V59M mice express similar mRNA levels of WT and mutant Kir6.2.
(A) Kir6.2 transcripts amplified by RT-PCR from islets isolated from 5-week-old β-V59M or WT mice were digested with BtsCI and loaded on a 2% agarose gel. Amplification of WT Kir6.2 cDNA generated a 282-bp product, which was cleaved by BtsCI into 177-bp and 105-bp products. Introduction of the V59M point mutation removed the unique BtsCI restriction site of the 282-bp amplicon, preventing its cleavage. Lanes 1 and 3, islets isolated from 2 different β-V59M mice. Lanes 2 and 4, islets isolated from 2 different WT mice. Lanes 5 and 6, positive controls using WT Kir6.2 and Kir6.2-V59M plasmids. In contrast with WT islets, β-V59M islets expressed the Kir6.2-V59M mutant gene, as demonstrated by the presence of a 282-bp BtsCI-resistant PCR product. (B) Lanes 1 and 2, RT-PCR of GFP using cDNA prepared from WT or β-V59M islets (isolated from β-V59M [1] and WT [1] mice shown in A, respectively). Lane 3, negative control. Lane 4, positive control using a plasmid-expressing GFP. GFP expression in β-V59M islets is demonstrated by amplification of a 328-bp product, which is absent in control islets. (C) Kir6.2 and SUR1 mRNA levels in islets isolated from 3-week-old WT or β-V59M mice, measured by quantitative PCR, and normalized to β2-microglobulin mRNA levels. Results are expressed as fold difference versus WT mice of the same litter. Results represent the mean ± SEM of 3 mice per genotype.
Figure 3
Figure 3. β-V59M mice develop severe hyperglycemia soon after birth.
(A and B) Mean body weight of β-V59M (gray; n = 4 minimum) and ROSA (Ctrl, black; n = 6 minimum) male (A) and female (B) mice. (C and D) Mean plasma glucose (G) concentrations for 3-day-old fed (C) and 5-week-old overnight-fasted (D) mice. The number of mice is given above each bar. Results represent mean ± SEM.
Figure 4
Figure 4. Insulin content and insulin secretion from control and β-V59M islets.
(A and B) Insulin content of islets (A, same islets as in D) and whole pancreas (B) isolated from 5-week-old control and mutant mice, as indicated. The number of mice is indicated above each bar. *P < 0.05 versus β-V59M. (C) Relative expression of the insulin gene in 5-week-old β-V59M islets, expressed as the fold difference from control islets. Data represent the mean ± SEM of a minimum of 3 mice per genotype. (D) Insulin secretion from perifused islets isolated from 5-week-old WT (squares, n = 5) or β-V59M (circles, n = 3) mice in response to 20 mM glucose or to 20 mM glucose plus 0.5 mM tolbutamide (Tolb). Secretion was normalized to insulin content to compensate for the difference in insulin content. Results represent mean ± SEM.
Figure 5
Figure 5. Mutant KATP channels are less sensitive to inhibition by ATP.
(A) Representative KATP channel currents recorded at –60 mV from inside-out patches excised from WT or β-V59M β cells isolated from 5-week-old mice. The dotted line indicates the zero current level. (B) Mean ATP concentration-inhibition relationships for 7 WT (open circles) and 5 β-V59M (closed circles) β cells (2 mice from each group). Current (I) is expressed relative to that in ATP-free solution (Ic). The curves represent the best fit of Equation 1 to the mean data, with IC50 = 25 μM and h = 0.87 (WT); and IC50 = 270 μM and h = 0.8 (β-V59M). (C) KATP channel currents at –60 mV before (c.a) and after (excised) excision from a WT or β-V59M β cell. The dotted line indicates the zero current level. (D) Mean KATP channel currents recorded at –60 mV before and after excision from 6 WT (white bars) or 9 β-V59M (black bars) β cells. Results represent mean ± SEM.
Figure 6
Figure 6. Mutant KATP channels are less sensitive to inhibition by glucose.
(A) Representative whole-cell KATP currents recorded in the perforated-patch configuration (to preserve cell metabolism) from WT and β-V59M β cells isolated from 5-week-old mice in response to ±10 mV voltage steps from a holding potential of –70 mV. (B) Mean whole-cell KATP channel currents recorded in glucose-free solution (perforated patch) from WT (white bars) and β-V59M (black bars) β cells. (C) Mean relationship between whole-cell KATP current and glucose concentration recorded in the perforated-patch configuration from 5 WT (open circles) and 8 β-V59M (closed circles) β cells. Current (I) is expressed relative to that in glucose-free solution (Ic). (D) Percentage of the whole-cell KATP currents blocked by 0.2 mM tolbutamide. Results represent mean ± SEM.
Figure 7
Figure 7. β-V59M islets show a decreased [Ca2+]i response to glucose.
(A and B) Representative changes in [Ca2+]i produced by glucose and tolbutamide in WT (A) or β-V59M (B) islets. Values above the traces give mean ± SEM calcium concentrations (in nM) in 2 mM glucose (at steady state), 20 mM glucose (peak or initial and steady state), and 0.2 mM tolbutamide (peak). Data are representative of 7–9 islets (n = 2 mice). (C and D) Confocal images of WT (C) and β-V59M (D) islets stained with fluo 4–AM. Circles indicate the regions from which data in the lower panels was taken. Scale bars = 50 μm. Lower panels show representative changes in [Ca2+]i produced by increasing glucose from 2 to 20 mM in 2 different regions of the islet (indicated in upper panels) for WT (C) and β-V59M (D) islets. Insets show amplified sections to demonstrate that [Ca2+]i oscillations are synchronized in WT but not β-V59M β cells.
Figure 8
Figure 8. KATP mutant islets have fewer β cells.
(A) Immunohistochemistry of representative pancreatic islets from 5-week-old β-V59M, WT, RIP-Cre, and ROSA mice, as indicated. Insulin-positive cells are stained green. Glucagon-positive cells are stained red. Original magnification, ×20. Scale bars: 20 μm. (B and C) Islet density expressed as number of islets per cm2 (B) and mean cross-sectional β cell area, expressed as percentage of total islet cross-sectional area (C). Data represent mean ± SEM of 3 mice per genotype (5 sections per mouse). *P < 0.05 versus β-V59M.

References

    1. Hattersley A.T., Ashcroft F.M. Activating mutations in Kir6.2 and neonatal diabetes: new clinical syndromes, new scientific insights, and new therapy. Diabetes. 2005;54:2503–2513. doi: 10.2337/diabetes.54.9.2503. - DOI - PubMed
    1. Flanagan S.E., Edghill E.L., Gloyn A.L., Ellard S., Hattersley A.T. Mutations in KCNJ11, which encodes Kir6.2, are a common cause of diabetes diagnosed in the first 6 months of life, with the phenotype determined by genotype. Diabetologia. 2006;49:1190–1197. doi: 10.1007/s00125-006-0246-z. - DOI - PubMed
    1. Ashcroft F.M. The Walter B. Cannon Physiology in Perspective Lecture, 2007. ATP-sensitive K+ channels and disease: from molecule to malady. Am. J. Physiol. Endocrinol. Metab. 2007;293:E880–E889. doi: 10.1152/ajpendo.00348.2007. - DOI - PubMed
    1. Pearson E.R., et al. Switching from insulin to oral sulfonylureas in patients with diabetes due to Kir6.2 mutations. N. Engl. J. Med. 2006;355:467–477. doi: 10.1056/NEJMoa061759. - DOI - PubMed
    1. Miki T., Seino S. Roles of KATP channels as metabolic sensors in acute metabolic changes. J. Mol. Cell. Cardiol. 2005;38:917–925. doi: 10.1016/j.yjmcc.2004.11.019. - DOI - PubMed

Publication types

MeSH terms