. 2008 Nov;16(11):369-75.
doi: 10.1007/BF03086181.

Coronary artery anomalies detected by MSCT-coronary angiography in the adult

Affiliations

Coronary artery anomalies detected by MSCT-coronary angiography in the adult

G J R Ten Kate et al. Neth Heart J. 2008 Nov.

Abstract

Background: Before coronary evaluation by modern imaging techniques was feasible, premorbid diagnoses of coronary artery anomalies (CAAs) were usually made fortuitously by invasive coronary angiography (ICA). However, this technique is limited by its invasive and projectional nature. Coronary magnetic resonance angiography (CMRA) and multi-slice computed tomography (MSCT) broadened clinical information by enabling visualisation of the coronary arteries in their anatomical environment.

Methods: This case series visualises and reviews anomalous coronary artery from the opposite sinus (ACAOS) and coronary artery fistulae. All CAAs were detected by means of 64-slice dual source computed tomography after 1000 cardiac scans at the Erasmus MC, Rotterdam, the Netherlands.

Results: Eight ACAOS cases, one anomalous left coronary artery from the pulmonary artery (ALCAPA) and one congenital aneurysm of an aortic sinus were found. Seven out often detected CAAs were considered malignant whereas three CAAs of the ACAOS type (retroaortic path) were considered benign. Significant coronary artery disease was found in three out of eight ACAOS cases. In one of the ACAOS cases complete evaluation of the anomalous coronary artery was limited by motion artifacts. All five cases of right ACAOS were referred for MSCT because the right coronary artery could not be located by invasive angiography.

Conclusion: All CAAs were easy to diagnose because of 3D imaging and high temporal and spatial resolution. High resolution made it possible to not only depict coronary artery abnormalities, but also to quantify luminal and vessel properties such as stenosis grade, aspects of plaque, anomalous vessel length, luminal area ratio and the asymmetry ratio. Because of its comprehensiveness, MSCT can be an effective imaging modality in patients suspected of coronary artery abnormalities caused by coronary artery disease, CAAs, or a combination of both. (Neth Heart J 2008;16:369-75.).

Keywords: anomalous coronary artery from the opposite sinus; computed tomography; coronary anomalies; coronary artery fistulae; invasive coronary angiography.


Figures

Figure 1
Figure 1
Volume-rendered images showing normal coronary anatomy: A) The LAD and PDA form a half-loop (arrows) and perfuse the interventricular septum in this right dominant system (superior view). B) The RCA and LCx form two half-loops forming the atrioventricular groove (arrowheads). They send out several branches in apical direction perfusing the right and leftside of the heart, respectively. The LAD has several diagonal branches (D) perfusing the anterior wall of the left ventricle. Encircling the atrioventricular groove from the left, we see the left circumflex coronary artery giving off two marginal obtuse branches (MO). C) Anterior view of main coronary arteries. The LM divides into the LAD and the LCx. In this patient, the LAD gives off three diagonal branches. The RCA gives off a large right ventricular branch (RVB). Ao=aorta, AR=antero-right coronary sinus, AL=antero-left coronary sinus, PA=pulmonary artery, LA=left atrium, RA=right atrium, A=apex of the heart, PDA=posterior descending coronary artery.
Figure 1
Figure 1
Volume-rendered images showing normal coronary anatomy: A) The LAD and PDA form a half-loop (arrows) and perfuse the interventricular septum in this right dominant system (superior view). B) The RCA and LCx form two half-loops forming the atrioventricular groove (arrowheads). They send out several branches in apical direction perfusing the right and leftside of the heart, respectively. The LAD has several diagonal branches (D) perfusing the anterior wall of the left ventricle. Encircling the atrioventricular groove from the left, we see the left circumflex coronary artery giving off two marginal obtuse branches (MO). C) Anterior view of main coronary arteries. The LM divides into the LAD and the LCx. In this patient, the LAD gives off three diagonal branches. The RCA gives off a large right ventricular branch (RVB). Ao=aorta, AR=antero-right coronary sinus, AL=antero-left coronary sinus, PA=pulmonary artery, LA=left atrium, RA=right atrium, A=apex of the heart, PDA=posterior descending coronary artery.
Figure 2
Figure 2
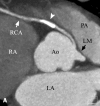
Left ACAOS (retroaortic course): A) Maximum intensity projection (MIP) of 4 mm thick slice. This image shows the LM originating from the right coronary sinus. The LM courses between the aorta and right atrium (dark surface) and between the aorta and leftatrium (highlighted surface) towards its dependent myocardial territory. Notethe bifurcation oftheLMintotheLCx andLAD coronary arteries (black arrowhead) and also the small conus branch with its separate ostium at the right sinus of Valsalva with a prevalence of about 50% (white arrowhead). B/C) Volume-rendered 3D images showing the contrast containing blood pool of the aorta, the coronary arteries and the left atrium. Only anatomy within the highest attenuation f actor range is visualised. Both the RCA and LM originate from the right sinus of Valsalva (anterior and posterolateral views). The LM curves backwards andfollows a retroaortic course. C) Image of the retroaortic course of the LM and its division in both the LAD and LCx coronary arteries. The upper part of the left atrium is made transparent. RA=right atrium, LA=left atrium, PA=pulmonary artery, LV=left ventricle, AR=anterior right coronary sinus, AL=anterior left coronary sinus, P=posterior coronary sinus, LCx=left circumflex coronary artery.
Figure 2
Figure 2
Left ACAOS (retroaortic course): A) Maximum intensity projection (MIP) of 4 mm thick slice. This image shows the LM originating from the right coronary sinus. The LM courses between the aorta and right atrium (dark surface) and between the aorta and leftatrium (highlighted surface) towards its dependent myocardial territory. Notethe bifurcation oftheLMintotheLCx andLAD coronary arteries (black arrowhead) and also the small conus branch with its separate ostium at the right sinus of Valsalva with a prevalence of about 50% (white arrowhead). B/C) Volume-rendered 3D images showing the contrast containing blood pool of the aorta, the coronary arteries and the left atrium. Only anatomy within the highest attenuation f actor range is visualised. Both the RCA and LM originate from the right sinus of Valsalva (anterior and posterolateral views). The LM curves backwards andfollows a retroaortic course. C) Image of the retroaortic course of the LM and its division in both the LAD and LCx coronary arteries. The upper part of the left atrium is made transparent. RA=right atrium, LA=left atrium, PA=pulmonary artery, LV=left ventricle, AR=anterior right coronary sinus, AL=anterior left coronary sinus, P=posterior coronary sinus, LCx=left circumflex coronary artery.
Figure 3
Figure 3
ACAOS of LCx (retroaortic course). The LCx has its ostium at the right coronary artery just after its origin at the anterior right coronary sinus: A) Maximum intensity projection (MIP) showing the anomalous course of the LCx between the aorta and the right and left atria. Note the calcified plaques in the LCx and the LM (arrowheads). Axial views of the LCX revealed significant stenosis (>50%) in this recently symptomatic patient. B) Volume-rendered image of coronary anatomy. The position of the PA was added for clarity. Note the LCx crossing thegreat cardiac vein (arrowheads). C) Invasive coronary angiography of the same patient. Note the stenosis in the LCx (arrowhead) at the location of the calcified lesion (figure A).
Figure 3
Figure 3
ACAOS of LCx (retroaortic course). The LCx has its ostium at the right coronary artery just after its origin at the anterior right coronary sinus: A) Maximum intensity projection (MIP) showing the anomalous course of the LCx between the aorta and the right and left atria. Note the calcified plaques in the LCx and the LM (arrowheads). Axial views of the LCX revealed significant stenosis (>50%) in this recently symptomatic patient. B) Volume-rendered image of coronary anatomy. The position of the PA was added for clarity. Note the LCx crossing thegreat cardiac vein (arrowheads). C) Invasive coronary angiography of the same patient. Note the stenosis in the LCx (arrowhead) at the location of the calcified lesion (figure A).
Figure 4
Figure 4
Right ARCAOS (interarterial course): A) Maximum intensity projection (MIP), superior view. The right coronary artery originates at the left sinus of Valsalva and courses between the aorta and the pulmonary artery. Note the significant calcified plaque (arrowhead). B) Volume-rendered image showing the anomalous path of the RCA (between arrowheads). C) Volume-rendered image showing the highly calcified plaque (white arrowhead). Note the high take-off of both the LM and RCA just above the aortic cusps. RA=right atrium, LA=left atrium, PA=pulmonary artery, Ao=aorta, AL/AR=anterior left and right aortic cusps, LV=left ventricle.
Figure 4
Figure 4
Right ARCAOS (interarterial course): A) Maximum intensity projection (MIP), superior view. The right coronary artery originates at the left sinus of Valsalva and courses between the aorta and the pulmonary artery. Note the significant calcified plaque (arrowhead). B) Volume-rendered image showing the anomalous path of the RCA (between arrowheads). C) Volume-rendered image showing the highly calcified plaque (white arrowhead). Note the high take-off of both the LM and RCA just above the aortic cusps. RA=right atrium, LA=left atrium, PA=pulmonary artery, Ao=aorta, AL/AR=anterior left and right aortic cusps, LV=left ventricle.
Figure 5
Figure 5
Right ACAOS (interarterial course): A) Volume-rendered image of left sinus of Valsalva (superior view) with B and C marking the intussuscepted and maximum vessel diameter respectively (pictures B and C). B) Luminal measurements at the ostium. '3D'software enables determination of the exact axial plane of a coronary artery. A 'pixel lens' was used to locate multiple 200 Houndsfield unit pixels for demarcation of the vessel border. The ovoid shape of the RCA was quantified by the asymmetry ratio as 0.33 (smallest/largest diagonal) (arrowheads). C) Cross section of RCA at point C. Luminal stenosis was quantified as 0.875 (luminal area ratio, see arrows).
Figure 5
Figure 5
Right ACAOS (interarterial course): A) Volume-rendered image of left sinus of Valsalva (superior view) with B and C marking the intussuscepted and maximum vessel diameter respectively (pictures B and C). B) Luminal measurements at the ostium. '3D'software enables determination of the exact axial plane of a coronary artery. A 'pixel lens' was used to locate multiple 200 Houndsfield unit pixels for demarcation of the vessel border. The ovoid shape of the RCA was quantified by the asymmetry ratio as 0.33 (smallest/largest diagonal) (arrowheads). C) Cross section of RCA at point C. Luminal stenosis was quantified as 0.875 (luminal area ratio, see arrows).
Figure 6
Figure 6
Aorto-atrial fistula (longitudinal and atrioventricular planes): A) Image of fistula between the aorta (supravalvular) and the right atrium. Calcification of the aortic valve is visible (black arrowhead). Note the tricuspid valve (black arrow). B) Image of atrioventricular plane (course of the RCA). Note the jet into the right atrium (arrowhead) showing a left to right shunt. RV=right ventricle, AR=anterior right sinus of Valsalva. Note the sinus coronarius (arrow).
Figure 6
Figure 6
Aorto-atrial fistula (longitudinal and atrioventricular planes): A) Image of fistula between the aorta (supravalvular) and the right atrium. Calcification of the aortic valve is visible (black arrowhead). Note the tricuspid valve (black arrow). B) Image of atrioventricular plane (course of the RCA). Note the jet into the right atrium (arrowhead) showing a left to right shunt. RV=right ventricle, AR=anterior right sinus of Valsalva. Note the sinus coronarius (arrow).
Figure 7
Figure 7
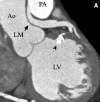
ALCAPA or Bland- White-Garland syndrome in a 61 -year-old female. After diagnosis, the anomalous LM was re-implanted in the aorta: A) Longitudinal view showing the connection between the pulmonary artery and the left main coronary artery. Note the difference in contrast intensity between the LM and the PA suggestive of retrograde flow in the left main coronary artery. In this patient extensive calcifications were visible in the RCA and left ventricle (arrowhead). B) Volume-rendered image (posterior view) showing the ostium of the LM at the right pulmonary artery. Note the large RCA with its impressive dependant myocardium. C) Anterior view of RCA with multiple collaterals directed towards the leftside of the heart. Note the corkscrew-like appearance of the large ventricular branch (VB) of the right coronary artery.
Figure 7
Figure 7
ALCAPA or Bland- White-Garland syndrome in a 61 -year-old female. After diagnosis, the anomalous LM was re-implanted in the aorta: A) Longitudinal view showing the connection between the pulmonary artery and the left main coronary artery. Note the difference in contrast intensity between the LM and the PA suggestive of retrograde flow in the left main coronary artery. In this patient extensive calcifications were visible in the RCA and left ventricle (arrowhead). B) Volume-rendered image (posterior view) showing the ostium of the LM at the right pulmonary artery. Note the large RCA with its impressive dependant myocardium. C) Anterior view of RCA with multiple collaterals directed towards the leftside of the heart. Note the corkscrew-like appearance of the large ventricular branch (VB) of the right coronary artery.

Similar articles

Cited by

References

    1. De Feyter PJ, Meijboom WB, Weustink A, Van Mieghem C, Mollet NR, Vourvouri E, et al. Spiral multislice computed tomography coronary angiography: a current status report. Clin Cardiol 2007;30:437-42. - PMC - PubMed
    1. Shi H Aschoff AJ, Brambs HJ, Hoffman MH. Multislice CT Imaging of anomalous coronary arteries. Eur Radiol 2004;14:2172-81. - PubMed
    1. Angelini P. Coronary Artery Anomalies; An Entity in search of an Identity. Circulation 2007;115:1296-305. - PubMed
    1. Angelini P, Trivellato M, Donis J, Leachman RD. Myocardial bridges: a review. Prog Cardiovasc Dis 1983;26:75-88. - PubMed
    1. Angelini P, Velasco JA, Ott D, Khoshnevis GR. Anomalous coronary artery arising from the opposite sinus: descriptive features and pathophysiologic mechanisms, as documented by intravascular ultrasonography. J Invasive Cardiol 2003;15:507-14. - PubMed

LinkOut - more resources