. 2009 Jan;49(1):160-74.
doi: 10.1002/hep.22636.

The cAMP effectors Epac and protein kinase a (PKA) are involved in the hepatic cystogenesis of an animal model of autosomal recessive polycystic kidney disease (ARPKD)

Affiliations

The cAMP effectors Epac and protein kinase a (PKA) are involved in the hepatic cystogenesis of an animal model of autosomal recessive polycystic kidney disease (ARPKD)

Jesús M Banales et al. Hepatology. 2009 Jan.

Abstract

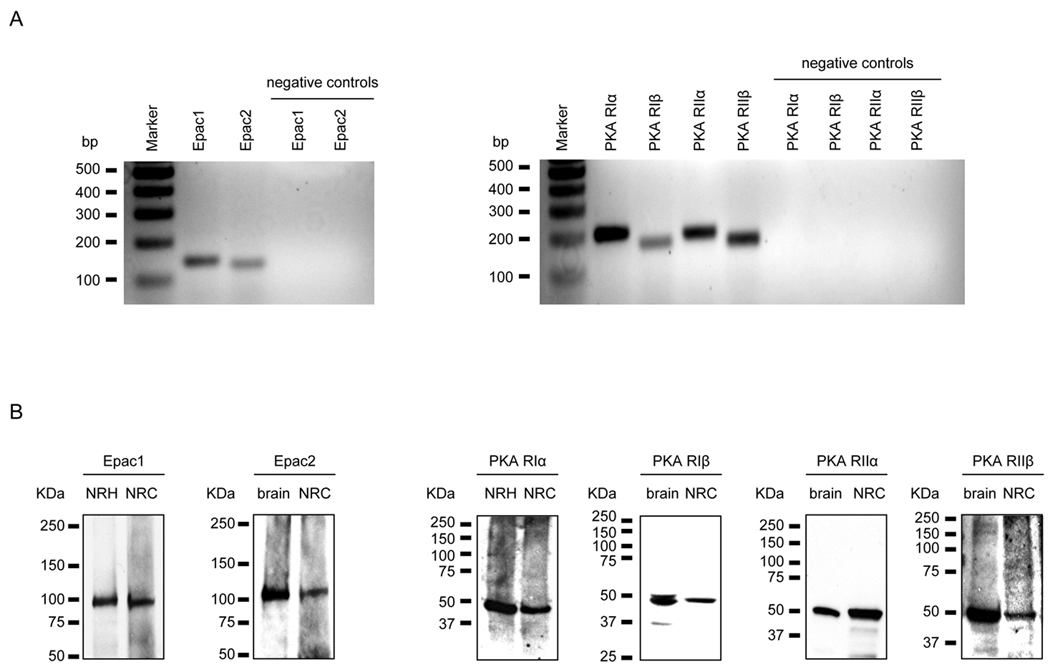
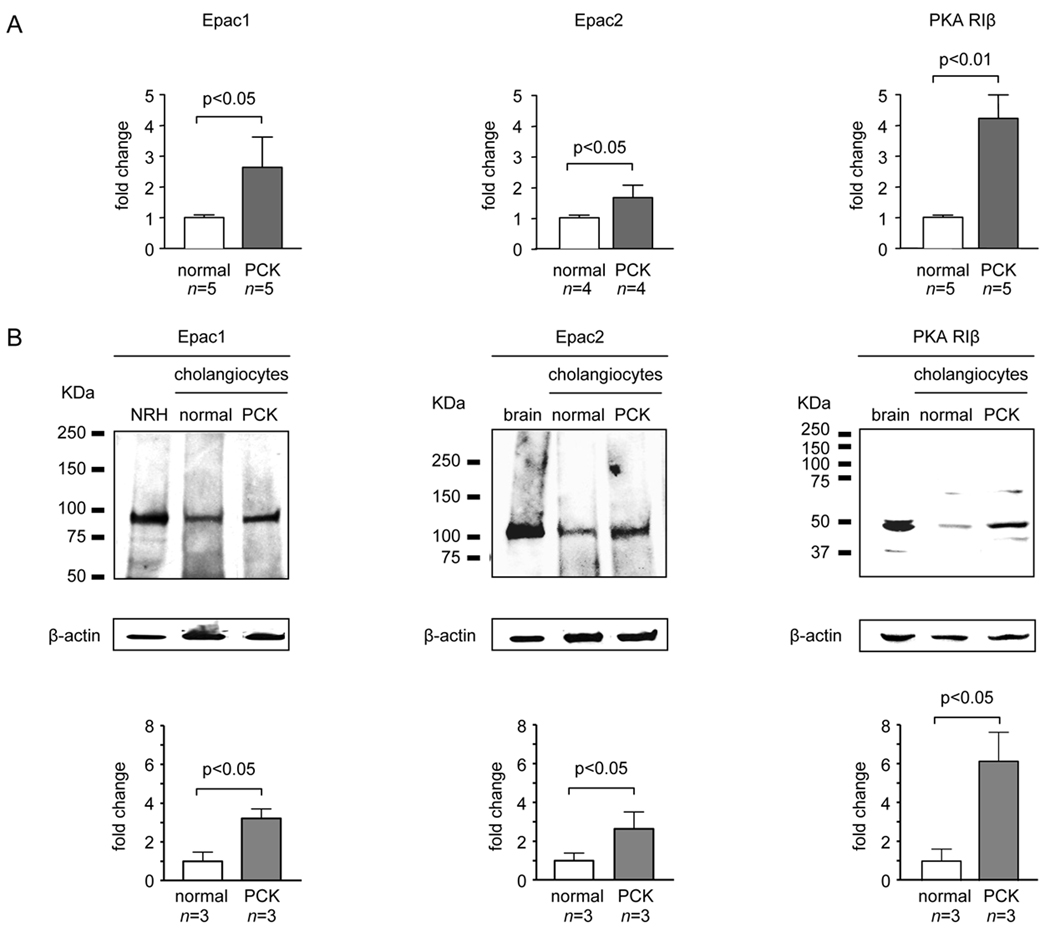
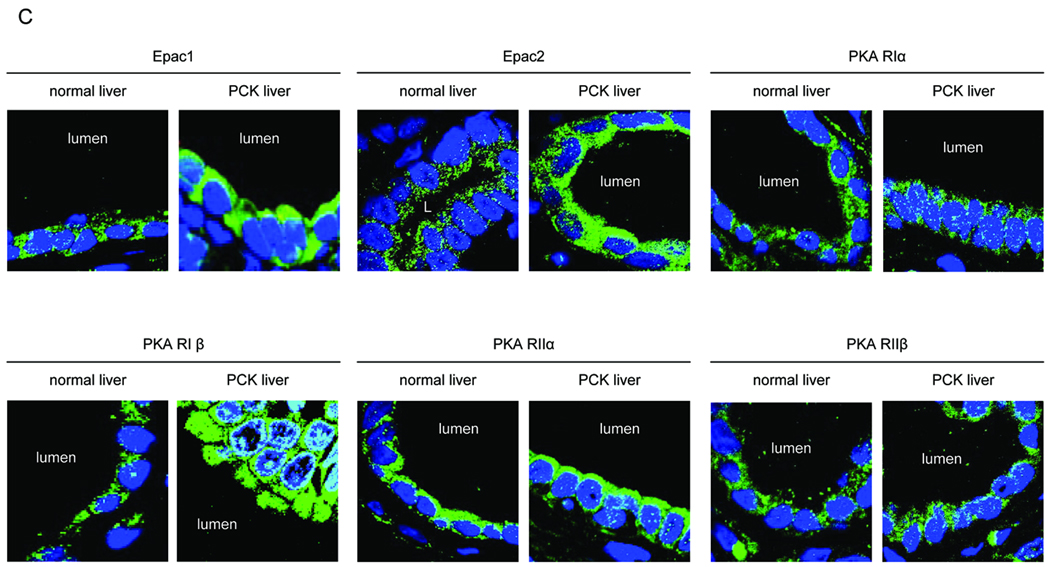
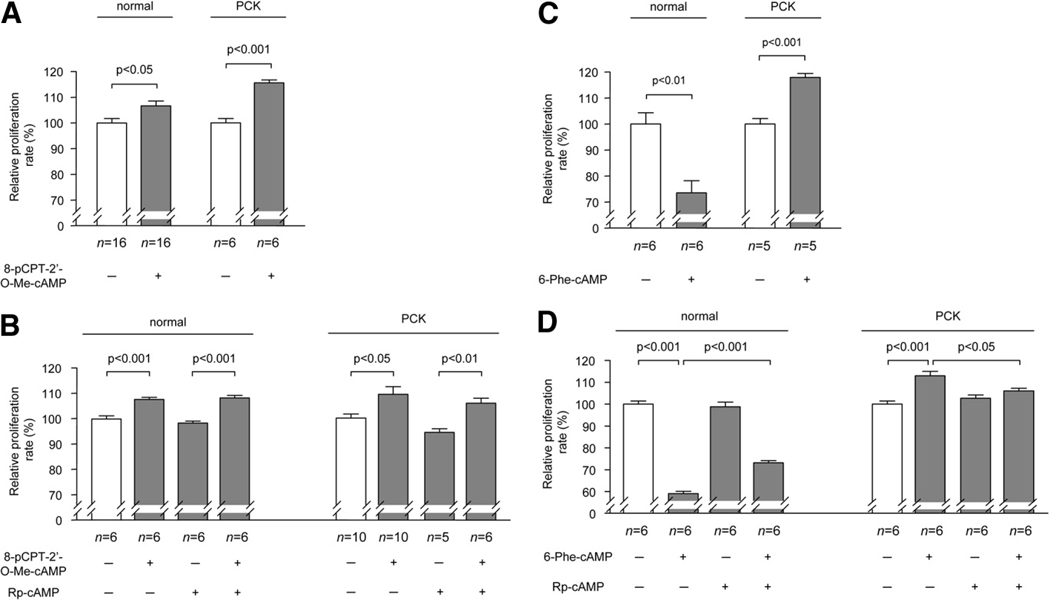
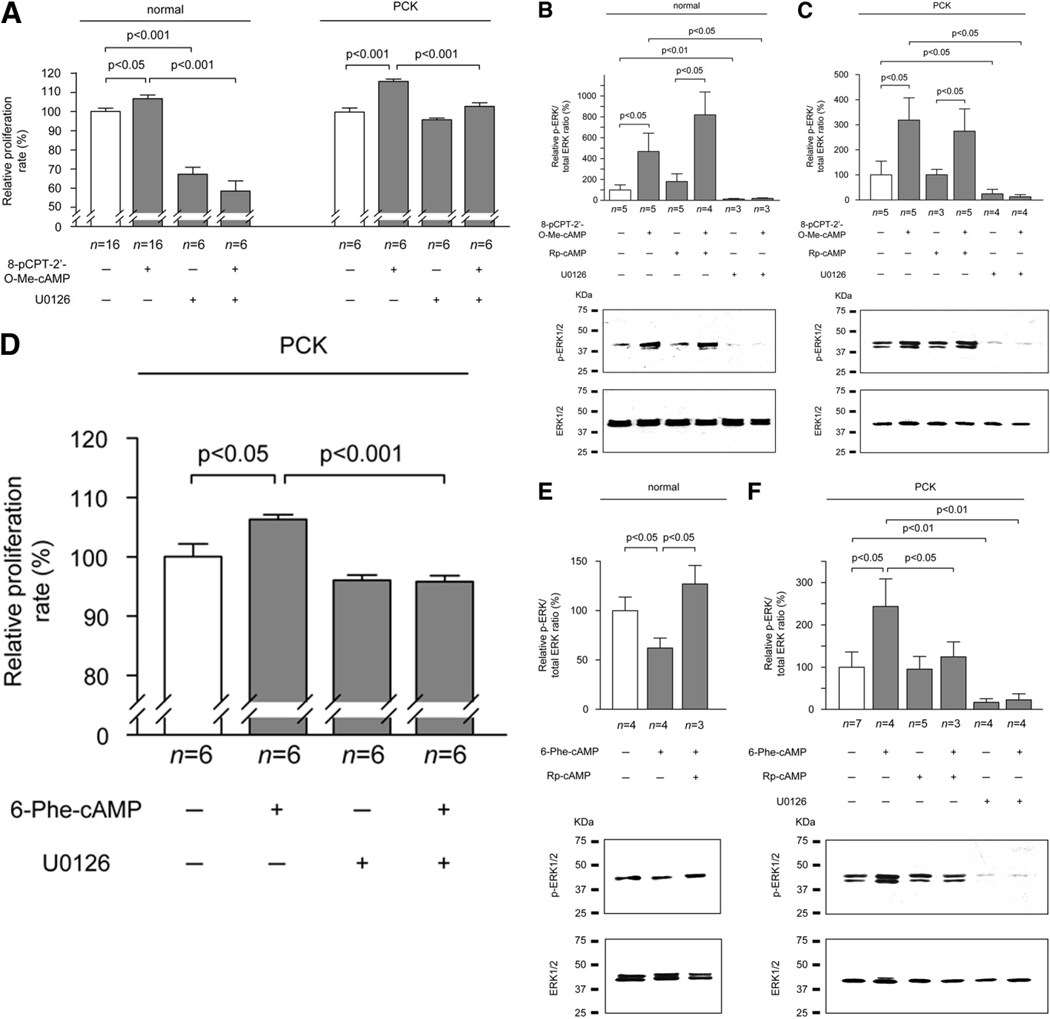
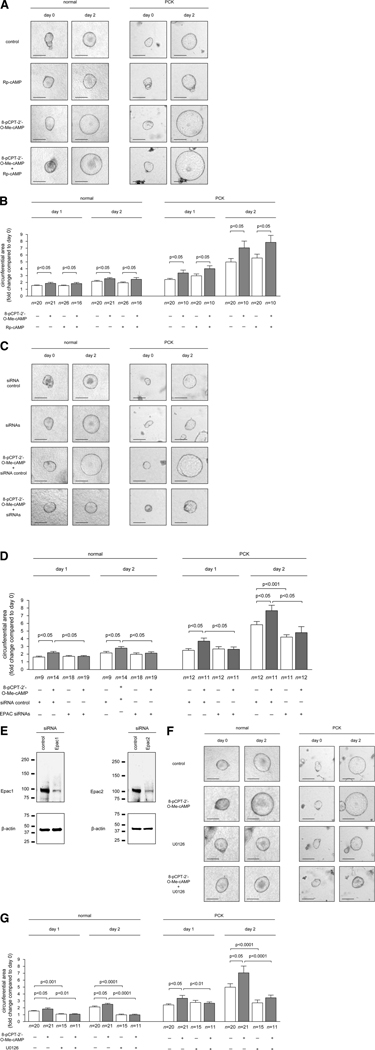
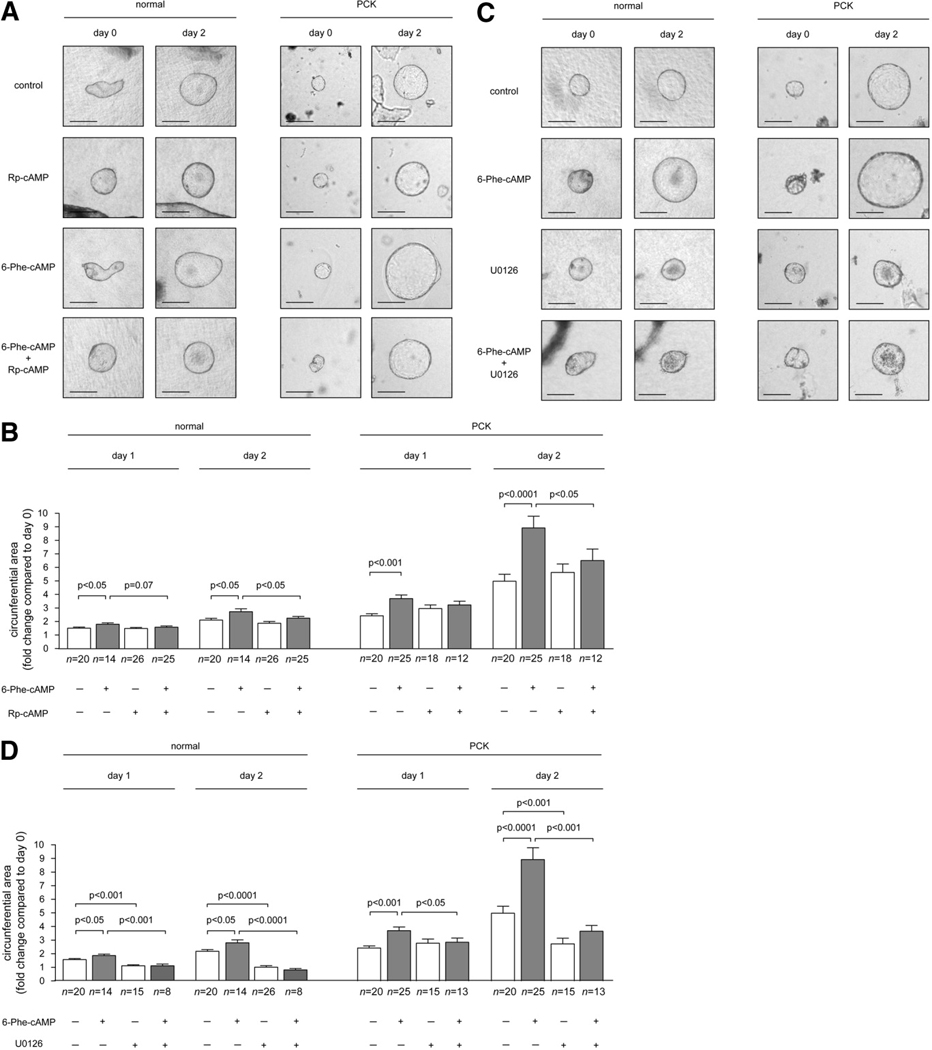
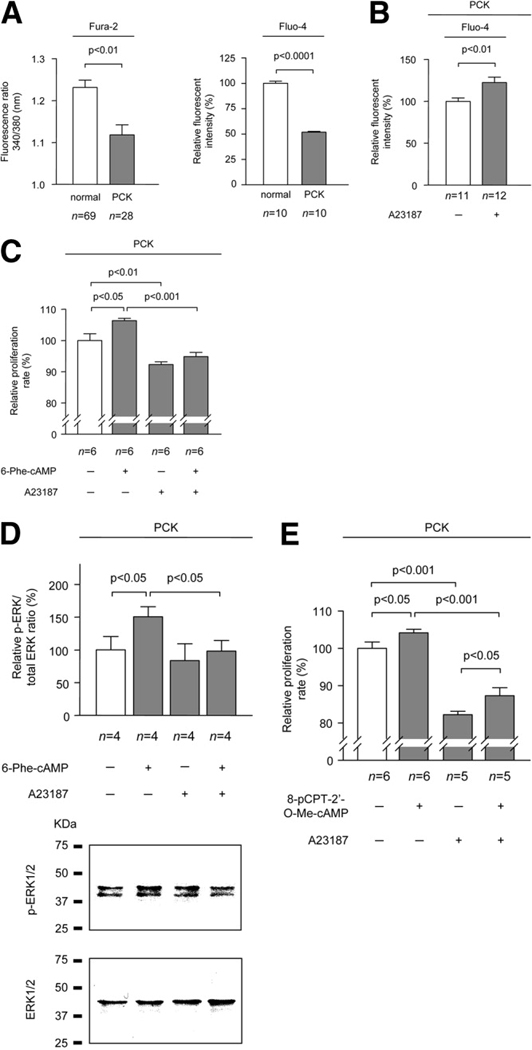
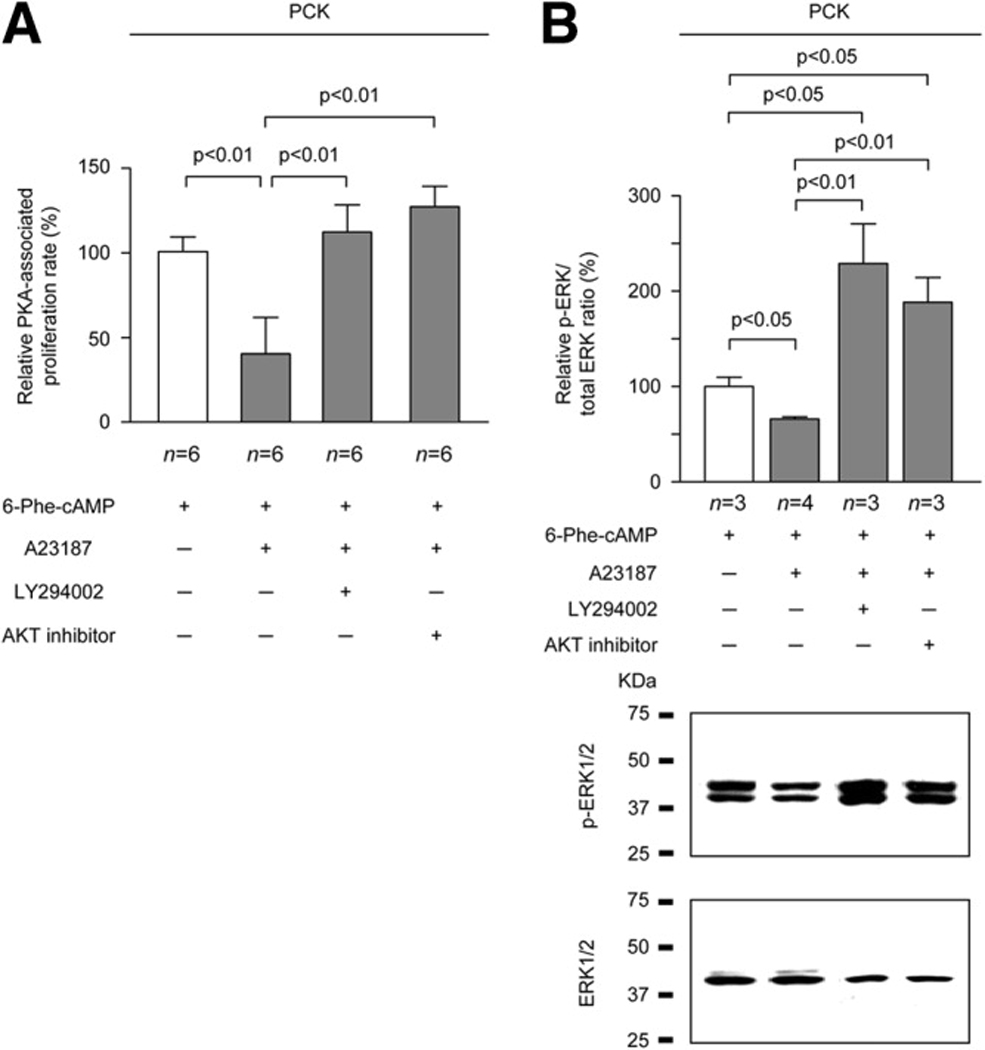
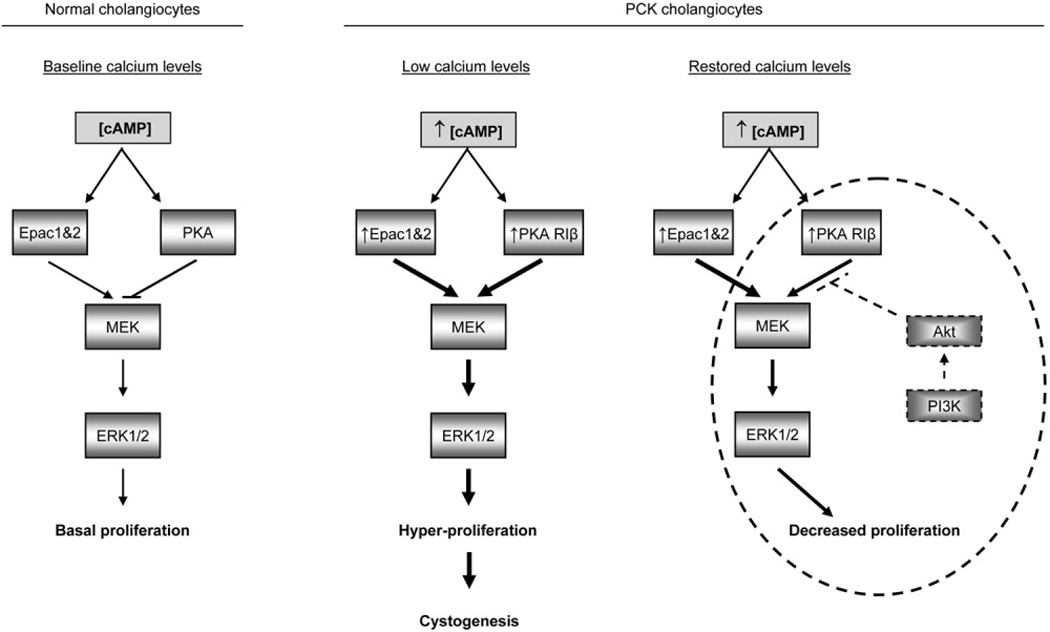
PCK rats, an animal model of autosomal recessive polycystic kidney disease (ARPKD), develop cholangiocyte-derived liver cysts associated with increased intracellular adenosine 3',5'-cyclic adenosine monophosphate (cAMP), the inhibition of which suppresses cyst growth. We hypothesized that elevated cAMP stimulates cholangiocyte proliferation via two downstream effectors, exchange proteins activated by cAMP (Epac1 and Epac2 isoforms) and protein kinase A (PKA), and that intracellular calcium is also involved in this process. Assessment of Epac isoforms and PKA regulatory subunits at the messenger RNA and protein level showed that cultured normal rat cholangiocytes express Epac1, Epac2, and all regulatory PKA subunits. Epac isoforms and the PKA RIbeta subunit were overexpressed in cultured PCK cholangiocytes. Proliferation analysis in response to Epac and PKA activation indicated that both normal and PCK cholangiocytes increase their growth upon Epac-specific stimulation, while PKA-specific stimulation results in differential effects, suppressing proliferation in normal cholangiocytes but accelerating this process in PCK cholangiocytes. On the other hand, both PKA and Epac activation of cystic structures generated by normal and PCK cholangiocytes when cultured under three-dimensional conditions resulted in increased cyst growth, particularly in PCK-cholangiocyte derived cysts. Pharmacological inhibitors and small interfering RNA-mediated gene silencing demonstrated the specificity of each effector activation, as well as the involvement of MEK-ERK1/2 signaling in all the observed effector-associated proliferation changes. Hyperproliferation of PCK cholangiocytes in response to PKA stimulation, but not to Epac stimulation, was found to be associated with decreased intracellular calcium, and restoration of calcium levels blocked the PKA-dependent proliferation via the PI3K/AKT pathway.

Conclusion: Our data provide strong evidence that both cAMP effectors, Epac and PKA, and the levels of intracellular calcium are involved in the hepatic cystogenesis of ARPKD.


Conflict of interest statement

No conflicts of interest exist.

Figures

Figure 1
Figure 1
Expression of Epac isoforms and PKA regulatory subunits in normal rat cholangiocytes. (A) RT-PCR shows that the mRNAs for Epac1, Epac2 and all four PKA regulatory subunits are expressed in cultured normal rat cholangiocytes (NRC). Negative controls with corresponding gene-specific primer pairs were performed in each case from a reversed-transcription with no RNAs (to exclude possible contamination). (B) Western blot analysis confirmed the expression of Epac isoforms and all four PKA regulatory subunits at the protein level in NRC (right lane each). As positive controls (left lanes), protein extracts from freshly isolated normal rat hepatocytes (NRH) were used for Epac1 and PKA RIα, while, protein extracts from normal rat brain tissue were used for remaining proteins (Epac2, PKA RIβ, PKA RIIα and PKA RIIβ). bp, base pairs.
Figure 2
Figure 2
Over-expression of Epac1, Epac2 and PKA RIβ in PCK cholangiocytes. (A) Real-time qPCR indicates that the mRNAs for Epac1, Epac2 and PKA RIβ are over-expressed (approx. 2.6-, 1.6-, 4.2- fold, respectively) in PCK cholangiocytes compared to normal. (B) Western blot analysis shows that expression of Epac1, Epac2 and PKA RIβ proteins are also increased (approx. 3-, 3- and 6-fold, respectively) in PCK cholangiocytes compared to normal. β-actin staining was employed as normalizing loading control. (C) Immunofluorescent confocal microscopy demonstrates that all Epac and PKA regulatory isoforms are located in the cytoplasm of normal and PCK cholangiocytes. Moreover, these images confirm the over-expression of Epac1, Epac2 and PKA RIβ in the cytoplasm of PCK cholangiocytes. Nuclei are stained in blue (with DAPI), while effector proteins are in green. L: lumen. n=number of experiments.
Figure 2
Figure 2
Over-expression of Epac1, Epac2 and PKA RIβ in PCK cholangiocytes. (A) Real-time qPCR indicates that the mRNAs for Epac1, Epac2 and PKA RIβ are over-expressed (approx. 2.6-, 1.6-, 4.2- fold, respectively) in PCK cholangiocytes compared to normal. (B) Western blot analysis shows that expression of Epac1, Epac2 and PKA RIβ proteins are also increased (approx. 3-, 3- and 6-fold, respectively) in PCK cholangiocytes compared to normal. β-actin staining was employed as normalizing loading control. (C) Immunofluorescent confocal microscopy demonstrates that all Epac and PKA regulatory isoforms are located in the cytoplasm of normal and PCK cholangiocytes. Moreover, these images confirm the over-expression of Epac1, Epac2 and PKA RIβ in the cytoplasm of PCK cholangiocytes. Nuclei are stained in blue (with DAPI), while effector proteins are in green. L: lumen. n=number of experiments.
Figure 3
Figure 3
Effects of Epac and PKA activation on cell proliferation of normal and PCK rat cholangiocytes. (A) Specific activation of Epac with 8-pCPT-2’-O-Me-cAMP increases cell proliferation in normal (p<0.05) and PCK cholangiocytes (p<0.001). (B) 8-pCPT-2’-O-Me-cAMP activation is Epac specific, as pre-incubation with the PKA inhibitor Rp-cAMP does not inhibit Epac-stimulated proliferation. (C) Activation of PKA with 6-Phe-cAMP decreases cell proliferation in cultured normal cholangiocytes, while stimulates this process in cultured PCK cholangiocytes. (D) These differential effects of 6-Phe-cAMP are PKA specific: the PKA inhibitor Rp-cAMP reversed the inhibitory effect of PKA activation on the proliferation of normal cholangiocytes, and decreased the rate of PKA-associated proliferation in PCK cholangiocytes. Given values are relative to the reference values (100%, depicted as white bars in each panel); n=number of experiments.
Figure 4
Figure 4
Role of MEK and ERK1/2 in the proliferation changes induced by Epac and PKA activation in cultured normal and PCK cholangiocytes. (A) MEK-specific inhibitor U0126 blocked Epac-activated proliferation in both normal and PCK cholangiocytes. (B–C) Phosphorylated ERK1/2 (p-ERK1/2) was increased in response to Epac activation in both normal and PCK rat cholangiocytes. This effect was not related to PKA, as pre-incubation with the PKA inhibitor Rp-cAMP did not inhibit Epac-stimulated phosphorylation. Moreover, both basal and Epac-stimulated ERK1/2 phosphorylation was blocked by the MEK-specific inhibitor U0126 in normal and PCK cholangiocytes. (D) PKA-stimulated proliferation was inhibited by the MEK-specific inhibitor in PCK cholangiocytes. (E) PKA activation reduced ERK1/2 phosphorylation in normal rat cholangiocytes, consistent with the notion that PKA activation suppresses proliferation in these cells. This effect was reversed in the presence of the PKA inhibitor Rp-cAMP. (F) Phosphorylated ERK1/2 (p-ERK1/2) was increased in response to PKA activation in PCK cholangiocytes, this effect being halted by pre-incubation with the PKA inhibitor Rp-cAMP. Moreover, both basal and PKA-stimulated ERK1/2 phosphorylation was blocked by the MEK-specific inhibitor U0126. Values presented are relative to the reference values (100%, depicted as white bars in each panel). n=number of experiments.
Figure 5
Figure 5
Epac activation increases expansion of 3-D cystic structures derived from normal and PCK cholangiocytes. (A) Representative images of normal and PCK cystic structures grown in 3-D culture for 24 and 48 hours in the presence of the Epac activator 8-pCPT-2’-O-Me-cAMP and the PKA inhibitor Rp-cAMP. (B) Epac activation for 24 and 48 hours increased the growth of normal-cholangiocyte and (to a greater extent) PCK-cholangiocyte derived cystic structures. Epac-stimulated growth was not affected by pre-incubation with the PKA inhibitor Rp-cAMP. (C) Representative images of normal and PCK cystic structures grown in 3-D culture for 24 and 48 hours in the presence of the Epac activator 8-pCPT-2’-O-Me-cAMP and siRNAs against Epac1 and Epac2. (D) The presence of siRNAs against Epac isoforms blocked Epac-stimulated cysts growth of both normal and PCK cystic structures at 24 and 48 hours. Moreover, the presence of siRNAs against Epac isoforms inhibited the basal cyst growth of PCK cystic structures. (E) Decreased protein levels of Epac1 and Epac2 after 72 hours incubation with siRNAs (between day -1 and day 2 of monitoring) confirmed effective Epac silencing. β-actin was employed as normalizing loading control. (F) Representative images of normal and PCK cystic structures grown in 3-D culture for 24 and 48 hours in the presence of the Epac activator 8-pCPT-2’-O-Me-cAMP and the MEK inhibitor U0126. (G) The MEK blocker U0126 inhibited both basal and Epac-stimulated growth of normal and PCK cystic structures. Bars = 250 µm.
Figure 6
Figure 6
PKA activation increases expansion of 3-D cystic structures derived from normal and PCK cholangiocytes. (A) Representative images of normal and PCK cystic structures grown in 3-D culture for 24 and 48 hours in the presence of the PKA activator 6-Phe-cAMP and the PKA inhibitor Rp-cAMP. B) PKA activation increases the growth of normal and (to a greater extent) PCK cystic structures. This effect is halted by pre-incubation with PKA inhibitor Rp-cAMP. (C) Representative images of normal and PCK cystic structures grown in 3-D culture for 24 and 48 hours in the presence of the PKA activator 6-Phe-cAMP and the MEK inhibitor U0126. (D) MEK inhibitor U0126 decreases both basal and PKA-stimulated growth of normal and PCK cystic structures. Bars = 250 µm.
Figure 7
Figure 7
Intracellular Ca2+ is decreased in PCK cholangiocytes being involved in their PKA-associated (but not their Epac-associated) proliferation. (A) Intracellular Ca2+ determination after loading cells with 10 µM of fura-2/AM or 3 µM of fluo-4-AM indicates that PCK cholangiocytes have lower levels of intracellular Ca2+ than normal cholangiocytes. (B) In PCK cholangiocytes, the presence of 0.1 µM Ca2+ ionophore A23187 resulted in 22% increase in fluo-4-AM fluorescence. (C) Elevation of intracellular Ca2+ levels with A23187 blocks both basal and PKA-associated proliferation in PCK cholangiocytes, and (D) reduces PKA-stimulated ERK1/2 phosphorylation. (E) A23187 does not affect the Epac-associated proliferation of PCK cholangiocytes. Except in A, depicted values are relative to the reference values (100%, white bars in panels B–E). n=number of experiments except for fura-2/AM in which n refers to number of cells analyzed.
Figure 8
Figure 8
Restoration of intracellular Ca2+ levels in PCK cholangiocytes inhibits PKA-associated proliferation via PI3K/AKT pathway. Suppression of either PI3K activity with the LY294002 inhibitor, or AKT activity with the 1L-6-hydroxymethyl-chiro-inositol 2-(R)-2-O-methyl-3-O-octadecylcarbonate inhibitor, each reversed the inhibitory effect of Ca2+ ionophore A23187 on both (A) PKA-associated proliferation and (B) PKA-associated ERK1/2 phosphorylation of PCK cholangiocytes. Given proliferation values are relative to the reference value of PKA-associated proliferation alone (100%) – hereby depicted as a white bar. To determine the combined effects of PKA activator and A23187 on PCK cholangiocyte proliferation in the presence of inhibitors, and before calculating the percentage of changes with respect to the 100% reference value (i.e.,PKA activation alone), the effect of A23187 with each inhibitor over the basal state was subtracted (to discard its possible inhibitory effects on the basal state). n=number of experiments.
Figure 9
Figure 9
Working model. Downstream effectors of the cAMP, Epac and PKA, differentially affect cell proliferation in cultured normal and PCK rat cholangiocytes. In normal cholangiocytes, Epac activation stimulates proliferation, while PKA activation suppresses this process. These effects involved ERK1/2 phosphorylation and dephosphorylation, respectively. However, in PCK cholangiocytes, which over-express Epac1, Epac2 and PKA RIβ and have decreased intracellular Ca2+, Epac and PKA both increase cell proliferation via MEK-ERK1/2 pathway. PKA-stimulated hyperproliferation of PCK cholangiocytes appears to be associated with decreased intracellular Ca2+ levels in these cells. Restoration of intracellular Ca2+ levels in cystic cholangiocytes activates PI3K and AKT signaling, that subsequently inhibits the PKA-associated proliferation observed in the original situation of low intracellular Ca2+. Epac-associated proliferation is not affected by changes in intracellular Ca2+ levels.

References

    1. Shneider BL, Magid MS. Liver disease in autosomal recessive polycystic kidney disease. Pediatr Transplant. 2005;9:634–639. - PubMed
    1. Nagasawa Y, Matthiesen S, Onuchic LF, Hou X, Bergmann C, Esquivel E, et al. Identification and characterization of Pkhd1, the mouse orthologue of the human ARPKD gene. J Am Soc Nephrol. 2002;13:2246–2258. - PubMed
    1. Ward CJ, Hogan MC, Rossetti S, Walker D, Sneddon T, Wang X, et al. The gene mutated in autosomal recessive polycystic kidney disease encodes a large, receptor-like protein. Nat Genet. 2002;30:259–269. - PubMed
    1. Masyuk TV, Huang BQ, Ward CJ, Masyuk AI, Yuan D, Splinter PL, et al. Defects in cholangiocyte fibrocystin expression and ciliary structure in the PCK rat. Gastroenterology. 2003;125:1303–1310. - PubMed
    1. Masyuk AI, Masyuk TV, Splinter PL, Huang BQ, Stroope AJ, LaRusso NF. Cholangiocyte cilia detect changes in luminal fluid flow and transmit them into intracellular Ca2+ and cAMP signaling. Gastroenterology. 2006;131:911–920. - PMC - PubMed

Publication types

MeSH terms

Substances