. 2009 Feb;5(2):152-8.
doi: 10.4161/auto.5.2.7348. Epub 2009 Feb 5.

Elevated ATG5 expression in autoimmune demyelination and multiple sclerosis

Affiliations

Elevated ATG5 expression in autoimmune demyelination and multiple sclerosis

Mehrdad Alirezaei et al. Autophagy. 2009 Feb.

Abstract

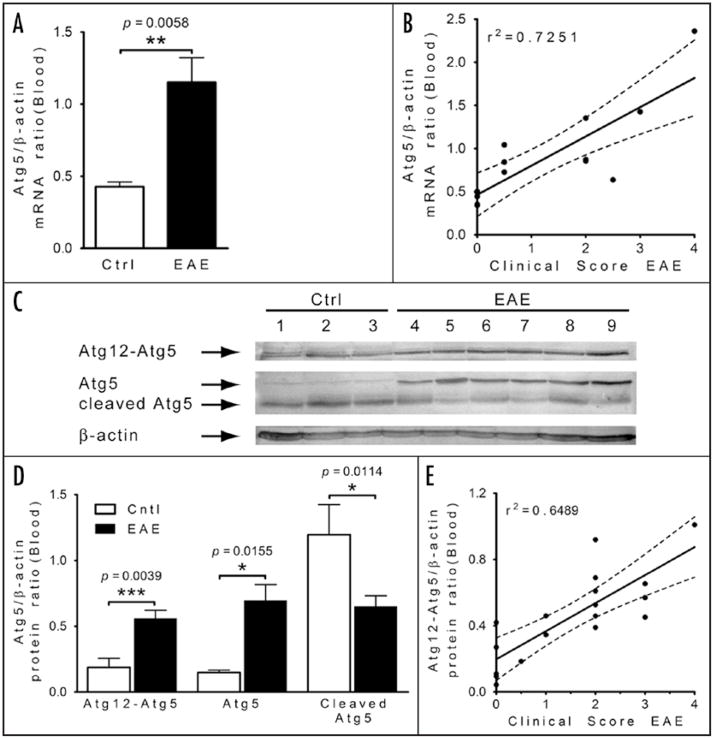
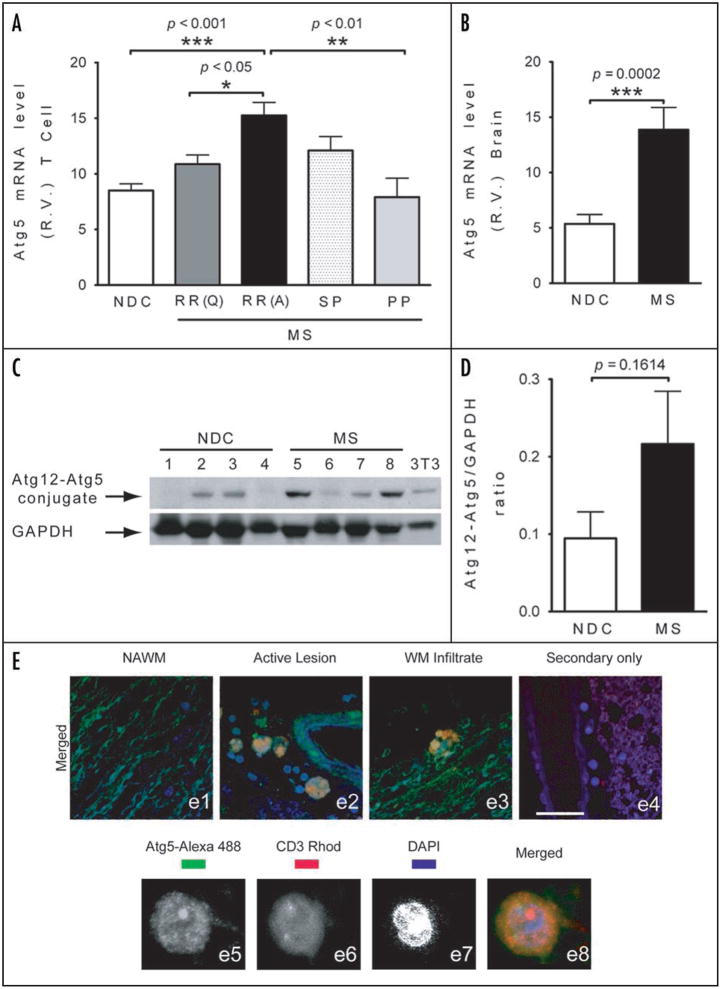
Multiple sclerosis (MS) is an inflammatory central nervous system (CNS) disorder characterized by T cell-mediated demyelination. In MS, prolonged T cell survival and increased T cell proliferation have been linked to disease relapse and progression. Recently, the autophagy-related gene 5 (Atg5) has been shown to modulate T cell survival. In this study, we examined the expression of Atg5 using both a mouse model of autoimmune demyelination as well as blood and brain tissues from MS cases. Quantitative real-time PCR analysis of RNA isolated from blood samples of experimental autoimmune encephalomyelitis (EAE) mice revealed a strong correlation between Atg5 expression and clinical disability.Analysis of protein extracted from these cells confirmed both upregulation and post-translational modification of Atg5, the latter of which was positively correlated with EAE severity. Analysis of RNA extracted from T cells isolated by negative selection indicated that Atg5 expression was significantly elevated in individuals with active relapsing-remitting MS compared to non-diseased controls. Brain tissue sections from relapsing-remitting MS cases examined by immunofluorescent histochemistry suggested that encephalitogenic T cells are a source of Atg5 expression in MS brain samples. Together these data suggest that increased T cell expression of Atg5 may contribute to inflammatory demyelination in MS.


Figures

Figure 1
Figure 1
Enhanced Atg5 expression in peripheral blood in mice correlates with clinical severity of EAE. (A) Comparative analysis of Atg5 mRNA expression by quantitative PCR of samples isolated from purified T cells of EAE (n = 10) and control (Ctrl) mice (n = 5). Student’s t-test used to derive the p value indicated on the graph. (B) Correlation study between the Atg5/β-actin ratio and clinical scores in EAE mice. Linear regression; r2 = 0.7251, p = 0.0001. (C) Western blot analysis of different forms of Atg5 (complex Atg12-Atg5, Atg5 and cleaved form of Atg5) isolated from T cells from Ctrl and EAE mice. Loading control was performed by re-probing the blot with an anti β-actin antibody. (D) Densitometry comparison of Atg12-Atg5 conjugates, Atg5 and cleaved form of Atg5 relative to β-actin as determined by western blot analysis (in C). Student’s t-test was used to derive the p value indicated on the graph, n = 5 for Ctrl and n = 13 for EAE mice. Student’s t-test used to derive the p value indicated on the graph. (E) Correlation analysis between the Atg12-Atg5/GAPDH ratio and clinical scores in EAE mice. Linear regression; r2 = 0.6489, p = 0.0001.
Figure 2
Figure 2
Increased Atg5 expression in peripheral blood T cells and in the brain of MS subjects. (A) Comparative analysis in relative values (R.V.) of Atg5 mRNA expression by quantitative PCR of samples isolated from purified T cells of NDC and patients with different categories of MS. ANOVA revealed significant differences between the groups (p = 0.0003), and a post-hoc Tukey’s test revealed the differences denoted in the graph. (B) Comparative analysis of Atg5 mRNA expression by quantitative PCR of samples isolated from brain specimens of MS (n = 6) and controls (n = 14). Student’s t-test was used to derive the p value indicated on the graph (p = 0.0002). (C) Western blot analysis of Atg12-Atg5 complex isolated from NDC subjects (1–4) and MS (5–8) brain specimens, with 3T3 cells providing a positive control. Protein loading was assessed by re-probing the blot with an antiGAPDH antibody. (D) Densitometric comparison of Atg12-Atg5 conjugates relative to GAPDH as determined by western blot analysis from MS samples (n = 4) and controls (n = 4) (in C). Unpaired student’s t-tests were performed to obtain the p values indicated on the graph. (E) Immunohistofluorescent detection of Atg5 protein in MS brain. (e1–e4) Merged images of brain sections from MS patients stained with antibodies against Atg5 (green), CD3 expression (red) and DAPI (blue). (e1) Normal appearing white matter (NAWM) of a MS patient. (e2) Active perivascular lesion in the brain of the same MS patient. (e3) Image of T cell (CD3+) infiltrating the white matter (WM) of another MS patient. (e4) Negative control of MS brain, using only the secondary fluorescent antibodies and DAPI. Scale Bar, 50 μm. (e5–e8) magnified images of Atg5 expression (green, e5) in a CD3+ T cell (red, e6) located in a blood vessel close to an injured area in the brain of a MS subject, with nucleus reacted with DAPI (blue, e7) and the merged image (e8).

References

    1. Todaro M, Zeuner A, Stassi G. Role of apoptosis in autoimmunity. J Clin Immunol. 2004;24:1–11. - PubMed
    1. Trapp BD, Nave KA. Multiple sclerosis: an immune or neurodegenerative disorder? Annual review of neuroscience. 2008;31:247–69. - PubMed
    1. Hebb AL, Moore CS, Bhan V, Robertson GS. Targeting apoptosis to treat multiple sclerosis. Curr Drug Discov Technol. 2008;5:75–7. - PubMed
    1. Zehntner SP, Bourbonniere L, Moore CS, Morris SJ, Methot D, St Jean M, Lacasse E, Hebb AL, Robertson GS, Durkin J, Gillard JW, Owens T. X-linked inhibitor of apoptosis regulates T cell effector function. J Immunol. 2007;179:7553–60. - PubMed
    1. Alirezaei M, Kiosses WB, Flynn CT, Brady NR, Fox HS. Disruption of Neuronal Autophagy by Infected Microglia Results in Neurodegeneration. PLoS ONE. 2008;3:2906. - PMC - PubMed

Publication types

MeSH terms