. 2008;3(12):e3881.
doi: 10.1371/journal.pone.0003881. Epub 2008 Dec 10.

Ecosystem overfishing in the ocean

Affiliations

Ecosystem overfishing in the ocean

Marta Coll et al. PLoS One. 2008.

Abstract

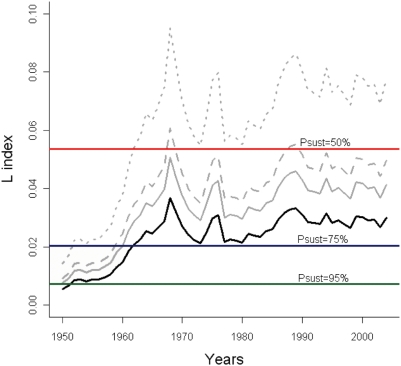
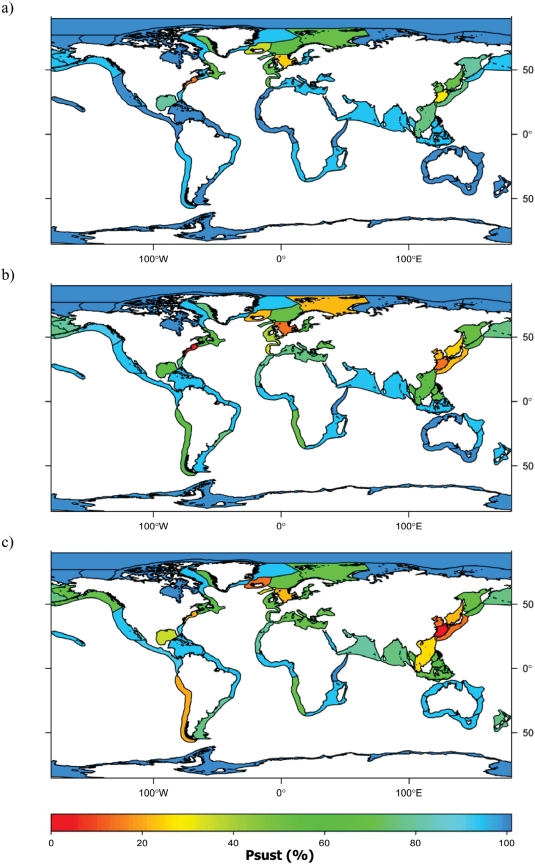
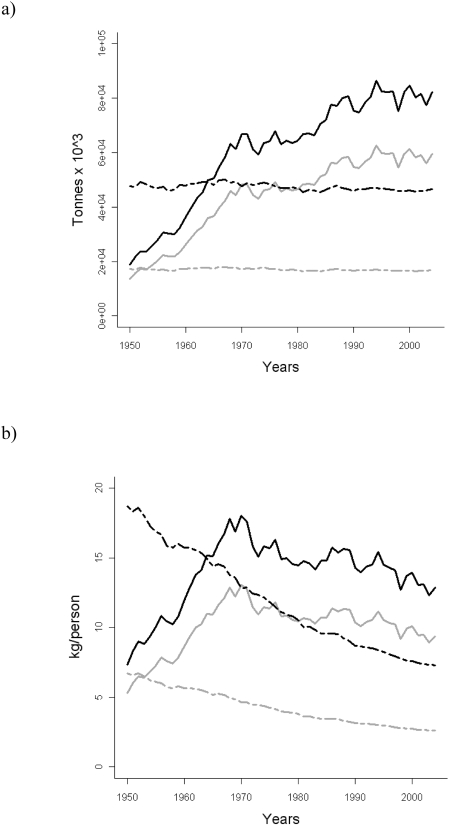
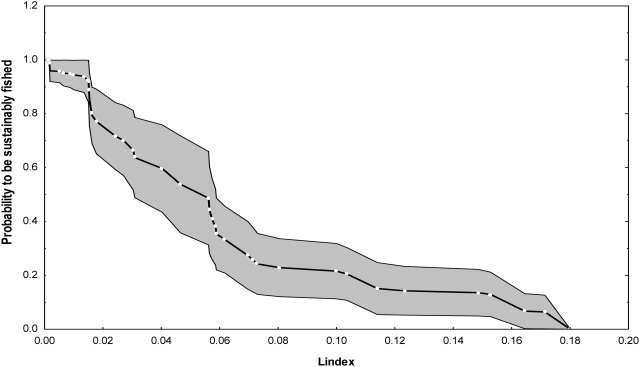
Fisheries catches represent a net export of mass and energy that can no longer be used by trophic levels higher than those fished. Thus, exploitation implies a depletion of secondary production of higher trophic levels (here the production of mass and energy by herbivores and carnivores in the ecosystem) due to the removal of prey. The depletion of secondary production due to the export of biomass and energy through catches was recently formulated as a proxy for evaluating the ecosystem impacts of fishing-i.e., the level of ecosystem overfishing. Here we evaluate the historical and current risk of ecosystem overfishing at a global scale by quantifying the depletion of secondary production using the best available fisheries and ecological data (i.e., catch and primary production). Our results highlight an increasing trend in the number of unsustainable fisheries (i.e., an increase in the risk of ecosystem overfishing) from the 1950s to the 2000s, and illustrate the worldwide geographic expansion of overfishing. These results enable to assess when and where fishing became unsustainable at the ecosystem level. At present, total catch per capita from Large Marine Ecosystems is at least twice the value estimated to ensure fishing at moderate sustainable levels.


Conflict of interest statement

Competing Interests: The authors have declared that no competing interests exist.

Figures

Figure 1
Figure 1. Ecosystem overfishing assessment for Large Marine Ecosystems during 2000–2004: a. Loss in production index (L) (values in the range 0–0.25), and b. Probability of being sustainably fished (psust, %), both taking into account official catches, discards and unreported estimates of 30% (sources: 13–17).
Figure 2
Figure 2. Assessment through time (1950–2004) for Loss in production (L index) with reference levels of 50%, 75% and 95% probability of being sustainably fished.
Official catch data (black) and corrected catch data with simulations of discards and unreported catches (grey scale; 30% IUU: solid line, 50% IUU: dashed line, 100% IUU: dotted line) are shown.
Figure 3
Figure 3. Historical ecosystem overfishing assessment for Large Marine Ecosystems: probability (%) of being sustainably fished (psust, %) during the a. 1950s, b. 1970s, and c. 1990s, taking into account official catches, discards and 30% unreported estimates (sources: 13–17).
Figure 4
Figure 4. Historical time series (1950–2004) of a. LMEs' catch (t·103·y−1) and b. LMEs' catch / total population (kg/person).
Catches and total catch per capita take into account official landings (grey) and official landings including discards and 30% unreported estimates (black). Ecosystem-Based Maximum Sustainable catches (total catches and per capita) in LME areas are reported for reference levels psust = 75% (black dashed) and psust = 95% (grey dashed).
Figure 5
Figure 5. Probability of being sustainably fished (psust) vs Loss in production index (L) values obtained by the application of the analyses of 51 classified models.
Nominal values refer to classified models, while averages and confidence intervals are obtained by applying resampling methods (Jackknife; number of random sub-sets, N = 500; length of sub-sets, k = 45). This plot can be used for a) assessing current level of exploitation for an ecosystem from an estimate of L index, b) estimating Ecosystem-based Maximum Sustainable Catches (EMSC), once a psust value is fixed as a reference level . This figure was modified from Libralato et al. (2008).

References

    1. Baum J, Myers RA, Kehler DG, Worm B, Harley SJ, et al. Collapse and Conservation of Shark Populations in the Northwest Atlantic. Science. 2003;299:389–392. - PubMed
    1. Myers RA, Worm B. Extinction, survival or recovery of large predatory fishes. Phil Trans R Soc B. 2005;360:13–20. - PMC - PubMed
    1. Jennings S, Kaiser MJ. The effects of fishing on marine ecosystems. Advances in Mar Biol. 1998;34:201–351.
    1. Jackson JBC, Kirby MX, Berger WH, Bjorndal KA, Botsford LW, et al. Historical Overfishing and the Recent Collapse of Coastal Ecosystems. Science. 2001;293:629–638. - PubMed
    1. Pauly D, Christensen V, Dalsgaard J, Froese R, Torres FJ. Fishing down marine food webs. Science. 1998;279:860–863. - PubMed

Publication types