. 2009 Mar;10(1):23-36.
doi: 10.1007/s10162-008-0150-y. Epub 2008 Dec 9.

Differential intracochlear sound pressure measurements in normal human temporal bones

Affiliations

Differential intracochlear sound pressure measurements in normal human temporal bones

Hideko Heidi Nakajima et al. J Assoc Res Otolaryngol. 2009 Mar.

Abstract

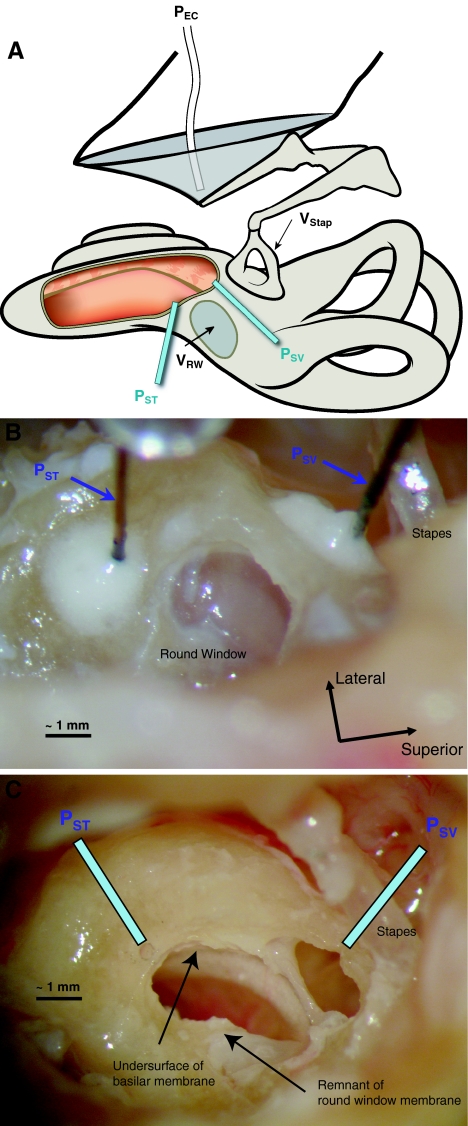
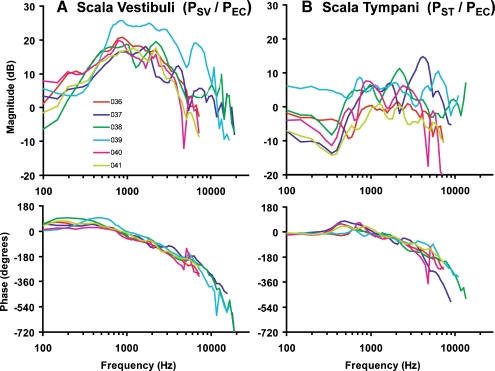
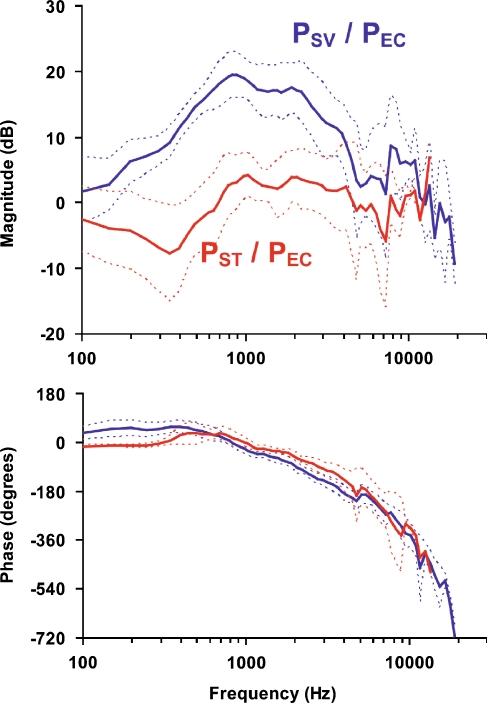
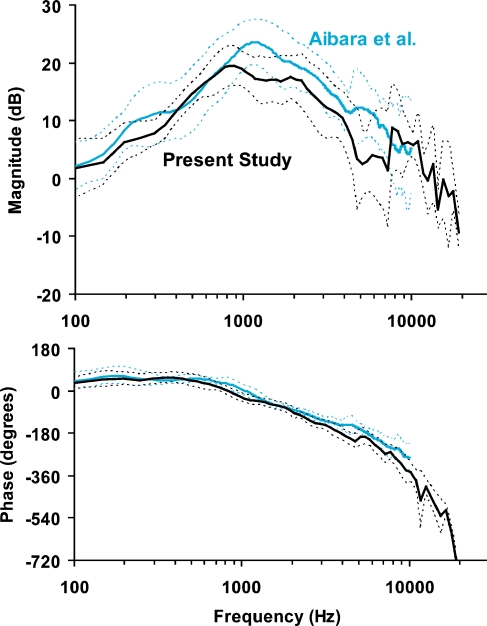
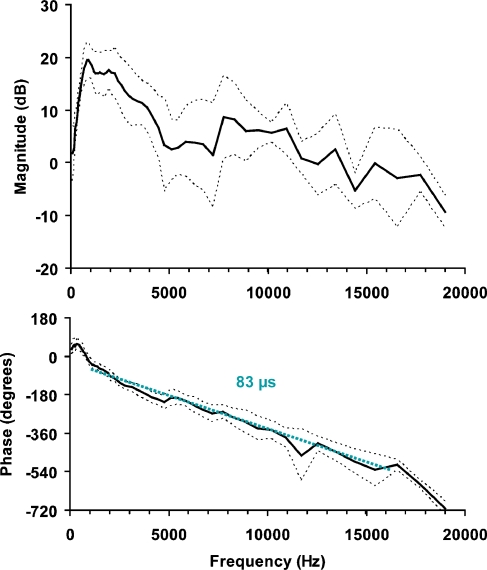
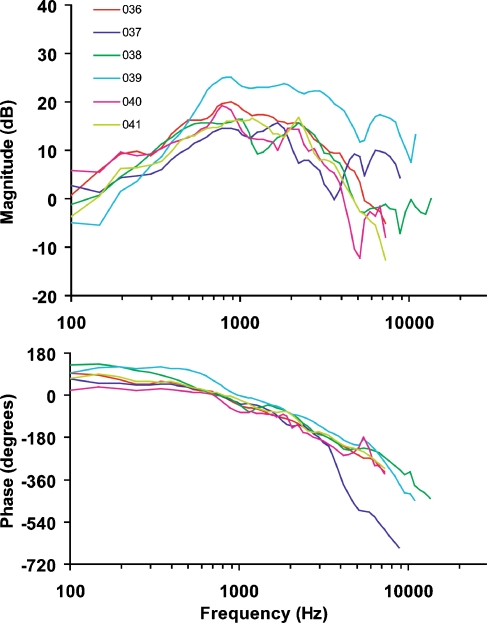
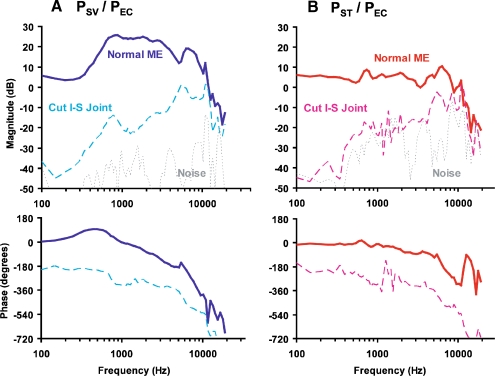
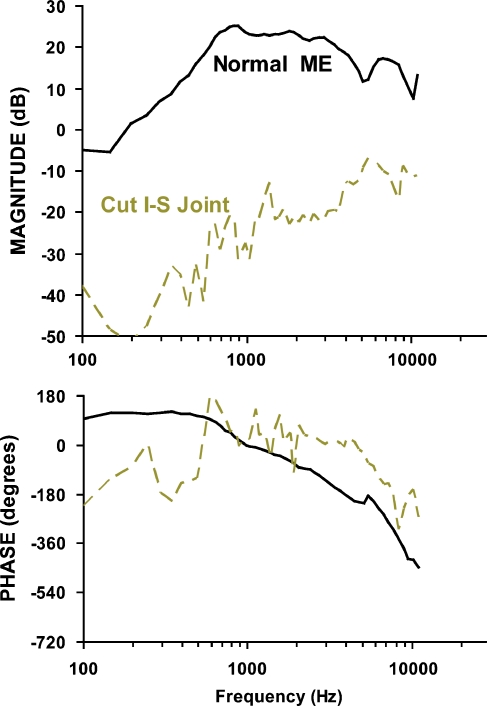
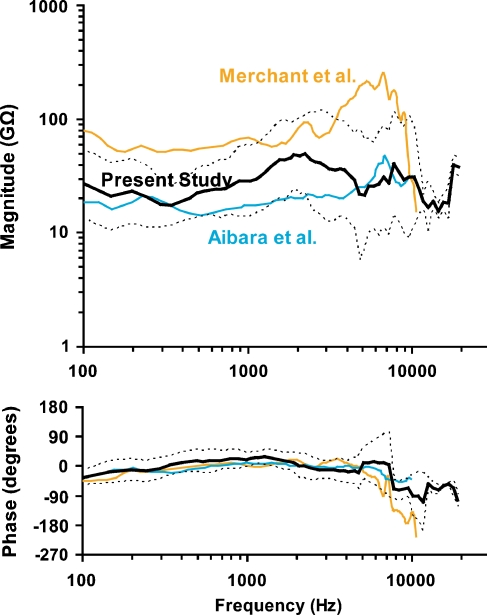
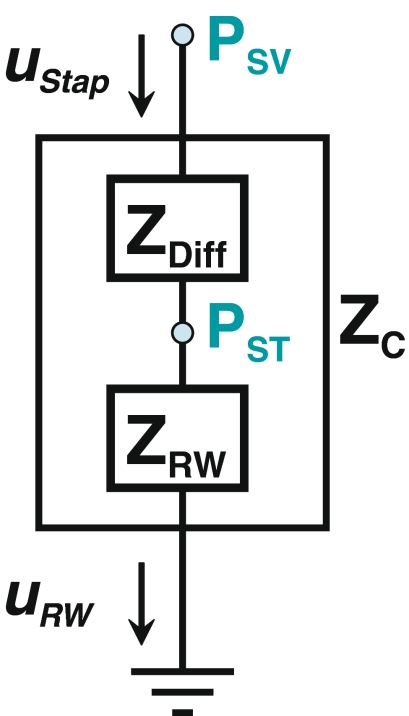
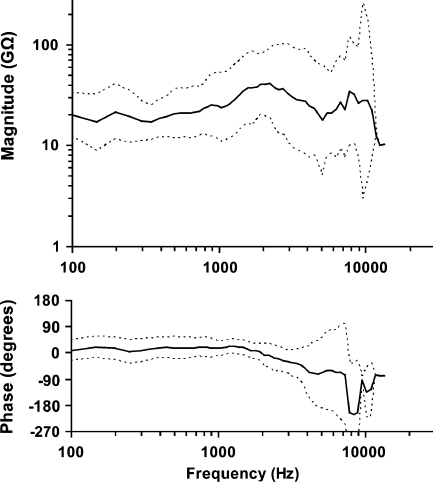
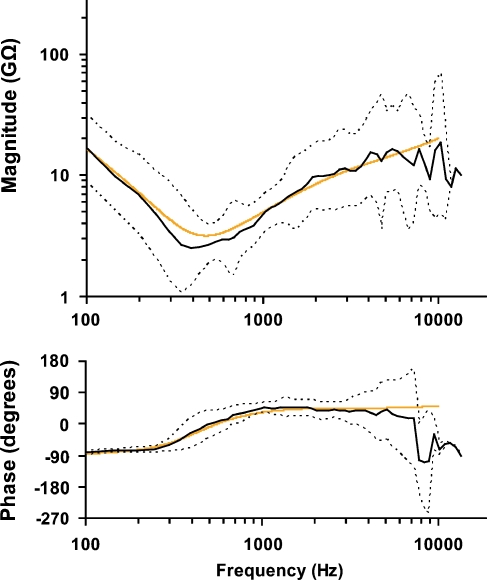
We present the first simultaneous sound pressure measurements in scala vestibuli and scala tympani of the cochlea in human cadaveric temporal bones. The technique we employ, which exploits microscale fiberoptic pressure sensors, enables the study of differential sound pressure at the cochlear base. This differential pressure is the input to the cochlear partition, driving cochlear waves and auditory transduction. In our results, the sound pressure in scala vestibuli (P (SV)) was much greater than scala tympani pressure (P (ST)), except for very low and high frequencies where P (ST) significantly affected the input to the cochlea. The differential pressure (P (SV) - P (ST)) is a superior measure of ossicular transduction of sound compared to P (SV) alone: (P (SV)-P (ST)) was reduced by 30 to 50 dB when the ossicular chain was disarticulated, whereas P (SV) was not reduced as much. The middle ear gain P (SV)/P (EC) and the differential pressure normalized to ear canal pressure (P (SV) - P (ST))/P (EC) were generally bandpass in frequency dependence. At frequencies above 1 kHz, the group delay in the middle ear gain is about 83 micros, over twice that of the gerbil. Concurrent measurements of stapes velocity produced estimates of cochlear input impedance, the differential impedance across the partition, and round window impedance. The differential impedance was generally resistive, while the round window impedance was consistent with compliance in conjunction with distributed inertia and damping. Our technique of measuring differential pressure can be used to study inner ear conductive pathologies (e.g., semicircular dehiscence), as well as non-ossicular cochlear stimulation (e.g., round window stimulation and bone conduction)--situations that cannot be completely quantified by measurements of stapes velocity or scala vestibuli pressure by themselves.


Figures

FIG. 1
FIG. 1
A Illustration showing the locations of various types of recordings: pressure in scala vestibuli (PSV), pressure in scala tympani (PST), pressure in the ear canal (PEC), velocity of the stapes (VStap), velocity of the round window (VRW). B Photograph of left temporal bone showing pressure sensors inserted into scala vestibuli (PSV) and scala tympani (PST). Jeltrate seals the holes surrounding the pressure probes. C Photograph of post-experimental preparation that has been opened to verify location of sensors. The hole used for scala tympani pressure sensor (PST) and the notch from the hole for scala vestibuli pressure sensor (PSV) can be seen. The cochlear partition and the basilar membrane can be seen through the opened round window area.
FIG. 2
FIG. 2
Sound pressure (magnitude and phase) in A scala vestibuli and B scala tympani, normalized to the ear canal sound pressure, for six temporal bones.
FIG. 3
FIG. 3
The means and standard deviations of the pressures in scala vestibuli and scala tympani relative to the ear canal pressure.
FIG. 4
FIG. 4
Comparison of the mean and standard deviation of the middle ear pressure gain (PSV/PEC) between Aibara et al. (n = 11, 2001) and the present study (n = 6).
FIG. 5
FIG. 5
This figure plots the same average magnitude and phase of our middle ear pressure gain as in Figure 4, on a linear scale. The linear phase above 1 kHz is consistent with a group delay of 83 μs.
FIG. 6
FIG. 6
Computed differential pressure, defined as the complex pressure difference across the partition normalized to ear canal pressure, (PSVPST)/PEC, for six temporal bones. This difference in pressure at the base of the cochlea represents the input signal to the cochlea.
FIG. 7
FIG. 7
An example (ear 039) of effects due to disrupting the ossicular chain. After disrupting the ossicular chain, there are large (20–40 dB) decreases in A scala vestibuli and B scala tympani pressures for frequencies <5 kHz. At higher frequencies, the decreases are smaller (10–20 dB), demonstrating conducted sound to both scalae without an intact middle ear.
FIG. 8
FIG. 8
Effect of ossicular discontinuity on the normalized differential pressure (PSVPST)/PEC. Disarticulation of the middle ear results in 30–50 dB decrease in the differential pressure, demonstrating the cancellation of similar high-frequency signals transmitted to both scalae (Fig. 9).
FIG. 9
FIG. 9
The differential pressure, (PSVPST)/PEC, across the partition in humans (mean and standard deviation, n = 6) is plotted with that of the cat (median, n = 6, Nedzelnitsky 1980) and the guinea pig (mean, n = 5, Dancer and Franke 1980).
FIG. 10
FIG. 10
Plot of the cochlear input impedance (ZC) with units of mks Ω (Pa s/m3). Our present study (n = 6) results in values of ZC that generally fall between previous measurements by Aibara et al. (, n = 12) and Merchant et al. (, n = 1).
FIG. 11
FIG. 11
The relationship of cochlear sound pressures and stapes volume velocity is described by this circuit. We assume that the volume velocities are the same for the stapes and the round window, UStap= URW. The cochlear input impedance (ZC) is the sum of the differential impedance (ZDiff) and the round window impedance (ZRW), ZC= ZDiff + ZRW. The ground connection at the bottom of the schematic represents the sound pressure in the middle ear cavity; we assume the pressure in the cavity is zero because in our preparation the middle ear cavity is widely opened to the atmosphere.
FIG. 12
FIG. 12
Differential input impedance (ZDiff). For frequencies below 1 kHz, ZDiff is consistent with an acoustic resistance.
FIG. 13
FIG. 13
Round window impedance, ZRW= PST/UStap is plotted with a black line for the mean and dotted lines for the standard deviation. Below 300 Hz, ZRW behaves as a compliance. Above 300 Hz, ZRW becomes dominated by inertia and resistance. This behavior is consistent with distributed loss and inertia, wherein impedance increases as approximately the square root of frequency much as in a system with “skin effect.” Behavior of a lumped parameter model for this system is plotted with gold-colored lines.
FIG. 14
FIG. 14
Lumped parameter circuit model of the round window impedance. The model includes an iterated Foster network to model high-frequency effects. Model parameters are C = 9 × 10−14 m3/Pa, L = 4.62 × 107 kg/m4, R = 2.34 × 108 Pa·s/m3, N = 6, X = 101/2.

References

    1. {'text': '', 'ref_index': 1, 'ids': [{'type': 'DOI', 'value': '10.1016/S0378-5955(00)00240-9', 'is_inner': False, 'url': 'https://doi.org/10.1016/s0378-5955(00)00240-9'}, {'type': 'PubMed', 'value': '11223285', 'is_inner': True, 'url': 'https://pubmed.ncbi.nlm.nih.gov/11223285/'}]}
    2. Aibara R, Welsh JT, Puria S, Goode RL. Human middle-ear sound transfer function and cochlear input impedance. Hear. Res. 152:100–109, 2001. - PubMed
    1. None
    2. Beranek LL. Acoustics. New York, McGraw-Hill, 1954.
    1. {'text': '', 'ref_index': 1, 'ids': [{'type': 'DOI', 'value': '10.1159/000091815', 'is_inner': False, 'url': 'https://doi.org/10.1159/000091815'}, {'type': 'PMC', 'value': 'PMC2917778', 'is_inner': False, 'url': 'https://pmc.ncbi.nlm.nih.gov/articles/PMC2917778/'}, {'type': 'PubMed', 'value': '16514236', 'is_inner': True, 'url': 'https://pubmed.ncbi.nlm.nih.gov/16514236/'}]}
    2. Chien W, Ravicz ME, Merchant SN, Rosowski JJ. The effect of methodological differences in the measurement of stapes motion in live and cadaver ears. Audiol. Neuro-otol. 11:183–197, 2006. - PMC - PubMed
    1. {'text': '', 'ref_index': 1, 'ids': [{'type': 'DOI', 'value': '10.1080/14992020600840903', 'is_inner': False, 'url': 'https://doi.org/10.1080/14992020600840903'}, {'type': 'PubMed', 'value': '17062502', 'is_inner': True, 'url': 'https://pubmed.ncbi.nlm.nih.gov/17062502/'}]}
    2. Colletti V, Soli SD, Carner M, Colletti L. Treatment of mixed hearing losses via implantation of a vibratory transducer on the round window. Int. J. Audiol. 45:600–608, 2006. - PubMed
    1. {'text': '', 'ref_index': 1, 'ids': [{'type': 'DOI', 'value': '10.1016/0378-5955(80)90057-X', 'is_inner': False, 'url': 'https://doi.org/10.1016/0378-5955(80)90057-x'}, {'type': 'PubMed', 'value': '7410227', 'is_inner': True, 'url': 'https://pubmed.ncbi.nlm.nih.gov/7410227/'}]}
    2. Dancer A, Franke R. Intracochlear sound pressure measurements in guinea pigs. Hear. Res. 2:191–205, 1980. - PubMed

Publication types

LinkOut - more resources