The neuronal substrates of human olfactory based kin recognition
- PMID: 19067327
- PMCID: PMC6870682
- DOI: 10.1002/hbm.20686
The neuronal substrates of human olfactory based kin recognition
Abstract
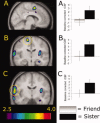
Kin recognition, an evolutionary phenomenon ubiquitous among phyla, is thought to promote an individual's genes by facilitating nepotism and avoidance of inbreeding. Whereas isolating and studying kin recognition mechanisms in humans using auditory and visual stimuli is problematic because of the high degree of conscious recognition of the individual involved, kin recognition based on body odors is done predominantly without conscious recognition. Using this, we mapped the neural substrates of human kin recognition by acquiring measures of regional cerebral blood flow from women smelling the body odors of either their sister or their same-sex friend. The initial behavioral experiment demonstrated that accurate identification of kin is performed with a low conscious recognition. The subsequent neuroimaging experiment demonstrated that olfactory based kin recognition in women recruited the frontal-temporal junction, the insula, and the dorsomedial prefrontal cortex; the latter area is implicated in the coding of self-referent processing and kin recognition. We further show that the neuronal response is seemingly independent of conscious identification of the individual source, demonstrating that humans have an odor based kin detection system akin to what has been shown for other mammals.
(c) 2008 Wiley-Liss, Inc.
Figures


Similar articles
-
Decoding an olfactory mechanism of kin recognition and inbreeding avoidance in a primate.BMC Evol Biol. 2009 Dec 3;9:281. doi: 10.1186/1471-2148-9-281. BMC Evol Biol. 2009. PMID: 19958525 Free PMC article.
-
Familiarity influences odor memory stability.Psychon Bull Rev. 2013 Aug;20(4):754-9. doi: 10.3758/s13423-013-0380-9. Psychon Bull Rev. 2013. PMID: 23341245
-
Odor-based recognition of familiar and related conspecifics: a first test conducted on captive Humboldt penguins (Spheniscus humboldti).PLoS One. 2011;6(9):e25002. doi: 10.1371/journal.pone.0025002. Epub 2011 Sep 21. PLoS One. 2011. PMID: 21957471 Free PMC article.
-
Understanding smell--the olfactory stimulus problem.Neurosci Biobehav Rev. 2013 Sep;37(8):1667-79. doi: 10.1016/j.neubiorev.2013.06.009. Epub 2013 Jun 25. Neurosci Biobehav Rev. 2013. PMID: 23806440 Review.
-
The muted sense: neurocognitive limitations of olfactory language.Trends Cogn Sci. 2015 Jun;19(6):314-21. doi: 10.1016/j.tics.2015.04.007. Epub 2015 May 12. Trends Cogn Sci. 2015. PMID: 25979848 Free PMC article. Review.
Cited by
-
Altered olfactory processing of stress-related body odors and artificial odors in patients with panic disorder.PLoS One. 2013 Sep 24;8(9):e74655. doi: 10.1371/journal.pone.0074655. eCollection 2013. PLoS One. 2013. PMID: 24086358 Free PMC article.
-
Scent of a Woman-Or Man: Odors Influence Person Knowledge.Brain Sci. 2021 Jul 20;11(7):955. doi: 10.3390/brainsci11070955. Brain Sci. 2021. PMID: 34356189 Free PMC article.
-
The smell of age: perception and discrimination of body odors of different ages.PLoS One. 2012;7(5):e38110. doi: 10.1371/journal.pone.0038110. Epub 2012 May 30. PLoS One. 2012. PMID: 22666457 Free PMC article.
-
Human olfaction: a constant state of change-blindness.Exp Brain Res. 2010 Aug;205(1):13-29. doi: 10.1007/s00221-010-2348-6. Epub 2010 Jul 7. Exp Brain Res. 2010. PMID: 20603708 Free PMC article. Review.
-
Induction of empathy by the smell of anxiety.PLoS One. 2009 Jun 24;4(6):e5987. doi: 10.1371/journal.pone.0005987. PLoS One. 2009. PMID: 19551135 Free PMC article.
References
-
- Ables EM,Kay LM,Mateo JM ( 2007): Rats assess degree of relatedness from human odors. Physiol Behav 90: 726–732. - PubMed
-
- Baglione V,Canestrari D,Marcos JM,Ekman J ( 2003): Kin selection in cooperative alliances of carrion crows. Science 300: 1947–1949. - PubMed
-
- Bjorkman M,Juslin P,Winman A ( 1993): Realism of confidence in sensory discrimination: the underconfidence phenomenon. Percept Psychophys 54: 75–81. - PubMed
-
- Dade LA,Zatorre RJ,Evans AC,Jones‐Gotman M ( 2001): Working memory in another dimension: Functional imaging of human olfactory working memory. Neuroimage 14: 650–660. - PubMed
-
- Djordjevic J,Zatorre RJ,Petrides M,Boyle JA,Jones‐Gotman M ( 2005): Functional neuroimaging of odor imagery. Neuroimage 24: 791–801. - PubMed
Publication types
MeSH terms
LinkOut - more resources
Full Text Sources
Medical

