. 2008 Nov;64(5):535-46.
doi: 10.1002/ana.21517.

Delayed neural network degeneration after neonatal hypoxia-ischemia

Affiliations

Delayed neural network degeneration after neonatal hypoxia-ischemia

Brian S Stone et al. Ann Neurol. 2008 Nov.

Abstract

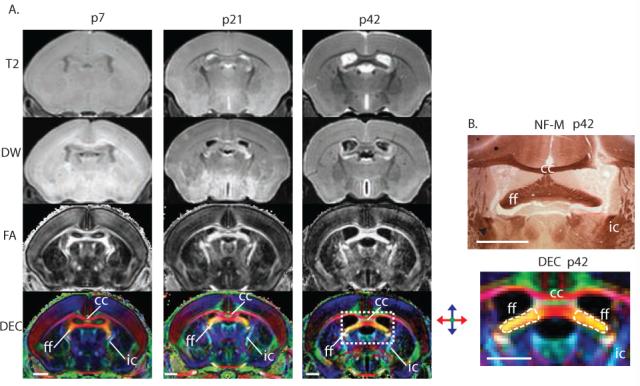
Objective: Clinical magnetic resonance studies show delayed and ongoing neurodegeneration after neonatal hypoxia-ischemia (HI), but the mechanisms and timing of this neurodegeneration remain unclear. We used ex vivo diffusion tensor imaging (DTI) and brain neuropathology to determine whether selective injury to white matter tracts occurs after neonatal HI in mice resulting in neural system-associated attrition in remote regions and at delayed times.

Methods: The Rice-Vannucci model (unilateral carotid ligation + 45 minutes of hypoxia FiO(2) = 0.08) was used to cause brain injury in postnatal day 7 (p7) C57BL6 mice, and ex vivo DTI and correlative neuropathology were performed at p8, p11, p15, p21, p28, and p42.

Results: DTI provides excellent contrast visualization of unmyelinated white matter in the immature mouse brain. Severe ipsilateral injury to the hippocampus is seen with both histopathology and diffusion-weighted magnetic resonance imaging 24 hours after injury. Injury to axons is evident 24 hours after HI in the hippocampal alveus. By p11 and continuing until p28, the ipsilateral fimbria fornix degenerates. At p15, there is injury and loss of axons entering the ipsilateral septal nucleus followed by ipsilateral septal atrophy. Volume loss in the hippocampus is rapid and severe, but is subacute and significantly slower in the ipsilateral septum. Neonatal HI also interrupts the normal developmental increase in fractional anisotropy in the ipsilateral fimbria but not in the contralateral fimbria from p8 to p42.

Interpretation: In neonatal brain, there is progressive systems-preferential injury after HI. DTI allows unparalleled visualization of this neural network-associated attrition so that it can be followed longitudinally in developing brain.


Figures

Figure 1
Figure 1
Segmentation of the septal region (A) and the hippocampus (B) in mouse brain. The boundaries of manually delineated septal region and hippocampus are overlaid on coronal diffusion-weighted MR images of a P42 mouse brain arranged in rostral-caudal order. Abbreviations are: ac: anterior commissure; aca: anterior part of the anterior commissure; cc: corpus callosum; ec: external capsule; f: fornix; fmj: forceps major of the corpus callosum; vhc: ventral hippocampal commissure. Scale bars = 1 mm.
Figure 2
Figure 2
Diffusion tensor imaging (DTI) provides superior contrast when imaging the immature mouse brain. (A) MRI sequences including T2-weighted (T2), diffusion-weighted (DW), fractional anisotropy (FA), and direction-encoded maps (DEC) are shown in the same coronal plane at p7, p21, and p42 respectively. Immature white matter tracts are labeled ff (fimbria fornix), cc (corpus callosum), and ic (internal capsule). (B) Matched neurofilament-M (NFM) and DEC imaging demonstrating the ff, cc, and ic at higher magnification. The fimbria fornix is outlined in a broken line representing the region of interest boundaries used to determine the fractional anisotropy of the ipsilateral and contralateral sides. Scale bars = 1mm.
Figure 3
Figure 3
Rapid and severe evolving injury to the ipsilateral hippocampus after neonatal HI in the mouse. (A) Flurojade C and Cresyl violet histopathology, and Ex-vivo MRI sequences including T2-weighted (T2), diffusion weighted (DW), fractional anisotropy (FA), and direction encoded maps (DEC), of C57BL6 forebrain at p8, p15, p21, and p28 after neonatal HI. Progression of porencephalic cyst formation post HI, follows initial neurodegeneration in the p8 hippocampus and cortex at p15, p21 and p28. T2 hyperintensity, abnormalities in diffusion and FA in the ipsilateral cortex and hippocampus at p8 match the neurodegeneration identified with flurojade C and portends subsequent development of porencephalic cyst in these regions. Compass colors represent white matter directionality in the DEC images. All scale bars = 1mm. Of note, p28 images and histology is slightly posterior relative to p8, p15, and p21. (B) Parenchymal volume loss and ventricular enlargement are seen with three-dimensional reconstruction (green=hippocampus, red=fimbria fornix, yellow=septal nuclei, blue=lateral ventricles and porencephalic cyst).
Figure 4
Figure 4
Injury to major hippocampal white matter pathways. (A) Paired direction-encoded image (DEC) and NF-M histology of the hippocampus illustrating patchy loss of DEC signal and NF-M in the ipsilateral alveus at p8 (dashed white arrow). Contralateral hippocampal alveus has DEC signal and NF-M present throughout the alveus (solid white arrow). Histology sections corresponding to the DEC image are shown. Drop out of NF-M is evident within the yellow boxed region in the ipsilateral alveus. Yellow boxes highlight regions shown at high power for examination of axonal pathology. Injured axons exiting the ipsilateral hippocampus are thickened, and tortuous with significant beading (dashed yellow arrow) compared to the smooth regular staining with NF-M in the contralateral alveus (solid yellow arrow). Compare ipsilateral and contralateral NF-M histology. Scale bars = 100 μm. (B) Degenerating axons in the ipsilateral fimbria labeled with linear silver deposits (white dashed arrows). Other degenerating cell bodies in the ipsilateral fimbria are dark and densely argyrophillic. Progressive loss of NF-M in the ipsilateral fimbria fornix (ff) and corresponding loss of signal identifying the ff in paired DEC images. Tractography with 3D reconstruction illustrates ipsilateral fimbria fornix fiber loss after HI. Compass colors represent white matter directionality in the DEC images in panels A and B. (C). Continued progression of injury to fimbria fornix with porencephalic cyst formation in the ipsilateral forebrain at p42. (loss of NF-M immunoreactivity, loss of signal in DEC image, and increased signal in the cyst area in T2-weighted (T2W) image). Scale bar for NF-M = 0.5mm, for DEC images =1mm.
Figure 5
Figure 5
Delayed degeneration of the septal nucleus following neonatal HI. T2-weighted (T2W) and DEC images along with corresponding neurofilament-M (NF-M) stained specimens at p8, p11, p15, p21, and p42 post neonatal HI. Boxed area in T2W image includes regions seen in corresponding DEC images and NF-M specimens. At p8, axons entering septal nuclei are symmetrical in both NF-M and DEC images (blue fornix fibers, blue-green septal fibers, and brown immunoreactivity (white arrows)). At later time points there is progressive loss of fimbria innervating the ipsilateral septal nucleus, loss of NF-M staining in the ipsilateral septal nucleus, and eventual collapse of lateral septal wall evident at 21 and p42. Septal nuclei and lateral ventricles are traced in DEC images (yellow and white outlines respectively).
Figure 6
Figure 6
Total hippocampus (A,B,D), dentate gyrus (B), and septal nucleus (C,D) degeneration after HI. Best-fit curve of total hippocampus (R=0.99) and dentate gyrus (R=0.99) obtained using exponential linear combination decay modeling (f=y0+a*exp(-b*x)+c*x), and best fit of septal nucleus (R=0.77) via single three parameter exponential decay modeling (f=y0+a*exp(-b*x)). 95% confidence intervals plotted in blue. Plots illustrate that hippocampal degeneration occurs early after HI, is severe, and there is some degree of recovery at later time points, where as septal nucleus degeneration occurs at later time points and has a more indolent course.

References

    1. Nelson KB, Grether JK. Causes of cerebral palsy. Curr Opin Pediatr. 1999;11:487–491. - PubMed
    1. Ferriero DM. Neonatal brain injury. N Engl J Med. 2004;351:1985–1995. - PubMed
    1. Hagberg H, Ichord R, Palmer C, et al. Animal models of developmental brain injury: relevance to human disease. A summary of the panel discussion from the Third Hershey Conference on Developmental Cerebral Blood Flow and Metabolism. Developmental neuroscience. 2002;24:364–366. - PubMed
    1. Folkerth RD. Neuropathologic substrate of cerebral palsy. J Child Neurol. 2005;20:940–949. - PubMed
    1. Rees S, Inder T. Fetal and neonatal origins of altered brain development. Early Hum Dev. 2005;81:753–761. - PubMed

Publication types

MeSH terms

LinkOut - more resources