. 2008 Nov 25;6(11):e287.
doi: 10.1371/journal.pbio.0060287.

Kin discrimination increases with genetic distance in a social amoeba

Affiliations

Kin discrimination increases with genetic distance in a social amoeba

Elizabeth A Ostrowski et al. PLoS Biol. .

Abstract

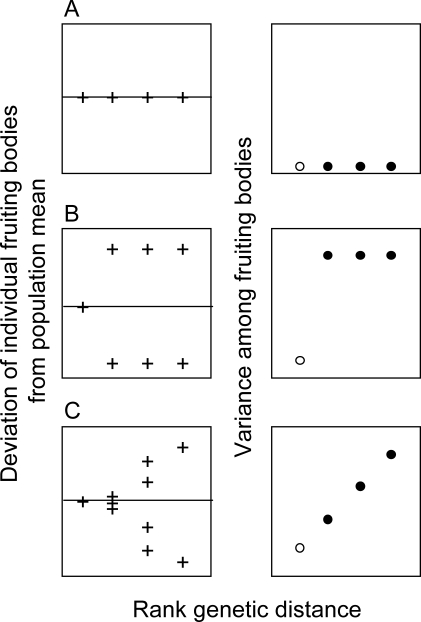
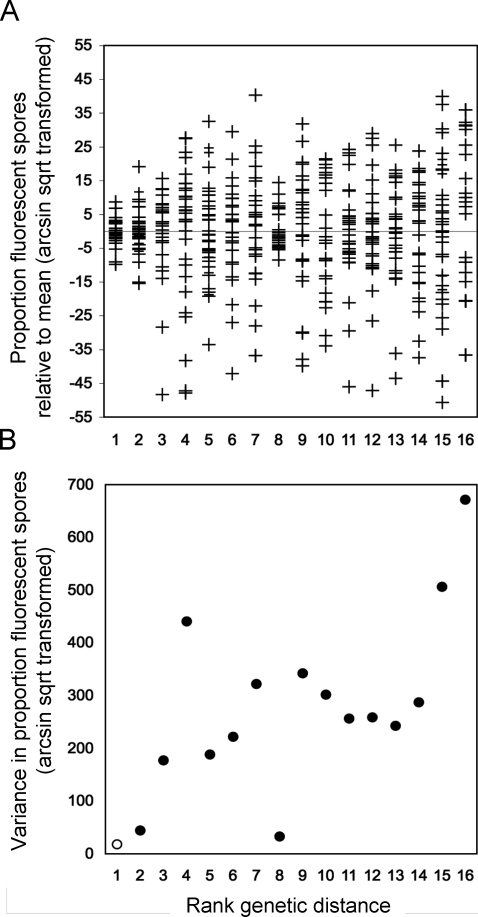
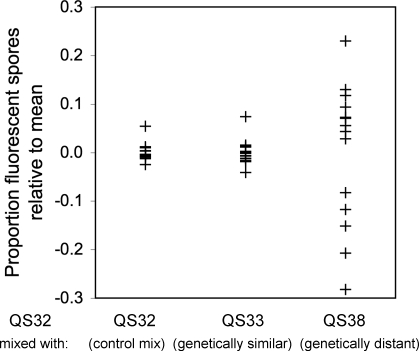
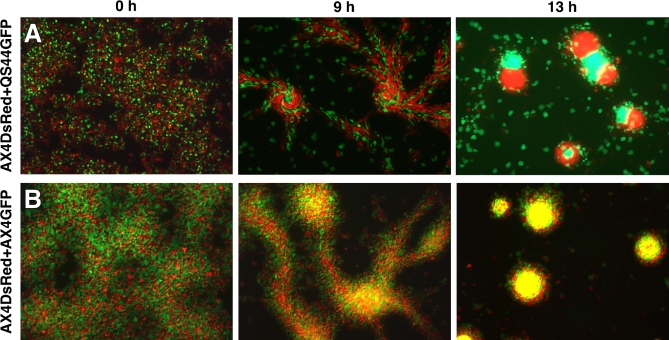
In the social amoeba Dictyostelium discoideum, thousands of cells aggregate upon starvation to form a multicellular fruiting body, and approximately 20% of them die to form a stalk that benefits the others. The aggregative nature of multicellular development makes the cells vulnerable to exploitation by cheaters, and the potential for cheating is indeed high. Cells might avoid being victimized if they can discriminate among individuals and avoid those that are genetically different. We tested how widely social amoebae cooperate by mixing isolates from different localities that cover most of their natural range. We show here that different isolates partially exclude one another during aggregation, and there is a positive relationship between the extent of this exclusion and the genetic distance between strains. Our findings demonstrate that D. discoideum cells co-aggregate more with genetically similar than dissimilar individuals, suggesting the existence of a mechanism that discerns the degree of genetic similarity between individuals in this social microorganism.


Conflict of interest statement

Competing interests. The authors have declared that no competing interests exist.

Figures

Figure 1
Figure 1. Hypothetical Patterns of Discrimination
(Left panel) Deviation of individual fruiting bodies from the mean of the population. Each symbol (+) represents an individual fruiting body, and mixes are plotted in order of increasing genetic distance. (Right panel) Variance among fruiting bodies plotted as a function of genetic distance. Open circles represent the control mix between genetically identical labeled and unlabeled cells. Full circles represent mixes between genetically distinct cells. We consider three hypotheses: (A) No discrimination. The left panel shows each fruiting body contains similar proportions of the two clones. The right panel shows the resulting variance among fruiting bodies is low and there is no difference between self-mixes (open circle) and non-self mixes (full circles). (B) Exclusive self–nonself discrimination. The left panel shows the labeled strain mixes well with genetically identical cells but poorly with other clones. The right panel shows there is a difference between the variance of the self mix and the nonself mixes, but no difference among the nonself mixes. (C) Discrimination according to genetic similarity. The left panel shows mixes of genetically identical cells produce well-mixed fruiting bodies, but segregation into distinct fruiting bodies is observed as the genetic distance between clones increases. The right panel shows increasing variance is proportional to the genetic distance between strains.
Figure 2
Figure 2. Segregation Increases with Genetic Distance in Mixed Fruiting Bodies
Reference cells (AX4-GFP) were mixed in equal proportions with test cells of various genetic distances, and the mixes were allowed to form fruiting bodies. The numbers of GFP-positive and negative spores were determined in ten individual fruiting bodies for each of three or four independent mixes. (A) Combined data from replicate mixes showing the proportion of GFP-positive spores in each fruiting body (+), centered around the mean and plotted as a function of the rank genetic distance from the reference strain AX4. (B) The average variance in the proportion of GFP-positive spores for each of 16 strains, plotted as above, based on three or four independent mix experiments for each strain pair. The correlation between the variance and the genetic distance was positive and statistically significant (Spearman's correlation ρ = 0.631, n = 16, p = 0.009), indicating greater segregation with increased genetic distance. Data for strains QS33 and QS32 are plotted separately (rank genetic distances 11 and 12, respectively) but were assigned tied ranks for the purposes of calculating the Spearman rank correlation coefficient.
Figure 3
Figure 3. The Property of Segregation Is Transitive and Robust to Strain Choice
Labeled reference cells (QS32) were mixed at equal proportions with unlabeled test cells: QS32 (genetically identical), QS33 (identical by 12 genetic markers but isolated from a different geographic location), and QS38 (identical at one genetic marker). The mixed cells were allowed to form fruiting bodies and the numbers of fluorescent and nonfluorescent spores were determined in at least ten fruiting bodies. The proportion of fluorescent spores in each fruiting body (+) is plotted as a function of the rank genetic distance from the reference strain QS32.
Figure 4
Figure 4. Sorting of Strains during Multicellular Development
Cells expressing either GFP or DsRed were mixed at equal proportions and allowed to develop on agar plates. Pictures were taken at the indicated developmental time points and the merged image of the two fluorophores is shown. (A) A mix of the genetically dissimilar strains AX4-DsRed and QS44-GFP shows increased segregation with time. (B) A mix of the genetically identical strains AX4-DsRed and AX4-GFP shows no segregation.

Comment in

References

    1. Hamilton WD. The genetical evolution of social behaviour. I, II. J Theor Biol. 1964;7:1–52. - PubMed
    1. West SA, Griffin AS, Gardner A, Diggle SP. Social evolution theory for microorganisms. Nat Rev Microbiol. 2006;4:597–607. - PubMed
    1. Crespi BJ. The evolution of social behavior in microorganisms. Trends Ecol Evol. 2001;16:178–183. - PubMed
    1. West SA, Diggle SP, Buckling A, Gardner A, Griffin AS. The social lives of microbes. Annu Rev Ecol Evol Syst. 2007;38:53–77.
    1. Ackermann M, Chao L. Evolution of cooperation: two for one. Curr Biol. 2004;14:R73–R74. - PubMed

Publication types