

Association of Malnutrition-Inflammation Score with quality of life and mortality in hemodialysis patients: a 5-year prospective cohort study
- PMID: 19070949
- PMCID: PMC5500250
- DOI: 10.1053/j.ajkd.2008.09.018
Association of Malnutrition-Inflammation Score with quality of life and mortality in hemodialysis patients: a 5-year prospective cohort study
Abstract
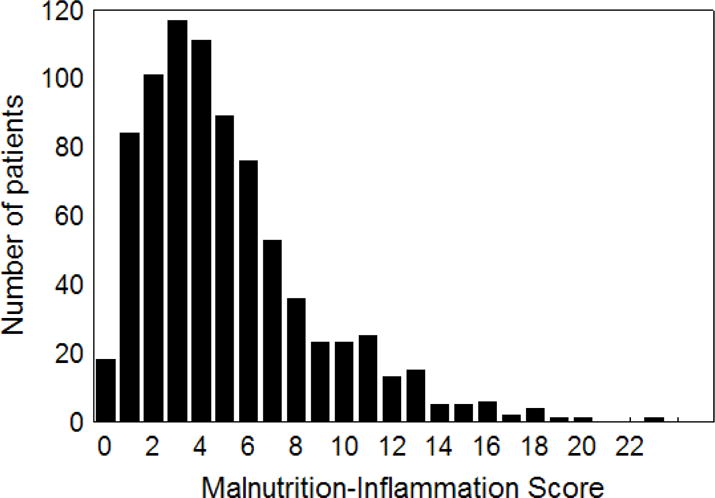
Background: The Malnutrition-Inflammation Score (MIS), an inexpensive and easy-to-assess score of 0 to 30 to examine protein-energy wasting (PEW) and inflammation, includes 7 components of the Subjective Global Assessment, body mass index, and serum albumin and transferrin concentrations. We hypothesized that MIS risk stratification of hemodialysis (HD) patients in predicting outcomes is better than its components or laboratory markers of inflammation.
Study design: 5-Year cohort study.
Setting & participants: We examined 809 stable HD outpatients and followed them for up to 5 years (October 2001 to December 2006).
Predictors: MIS and other nutritional and inflammatory markers.
Outcomes & measurements: Prospective all-cause mortality, health-related quality of life using the 36-Item Short Form Health Survey (SF-36), and tests of body composition.
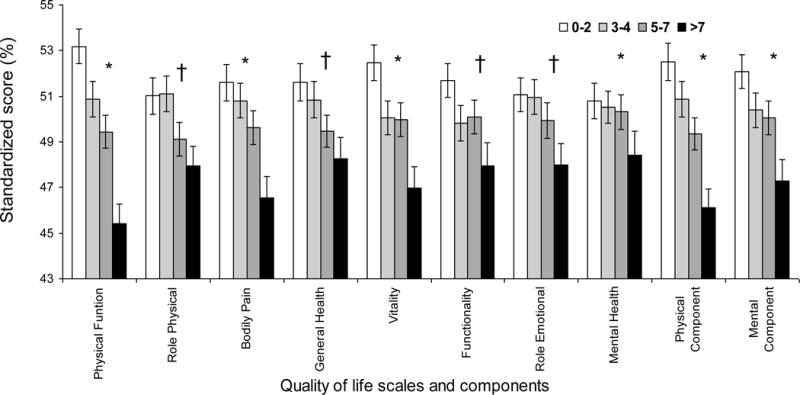
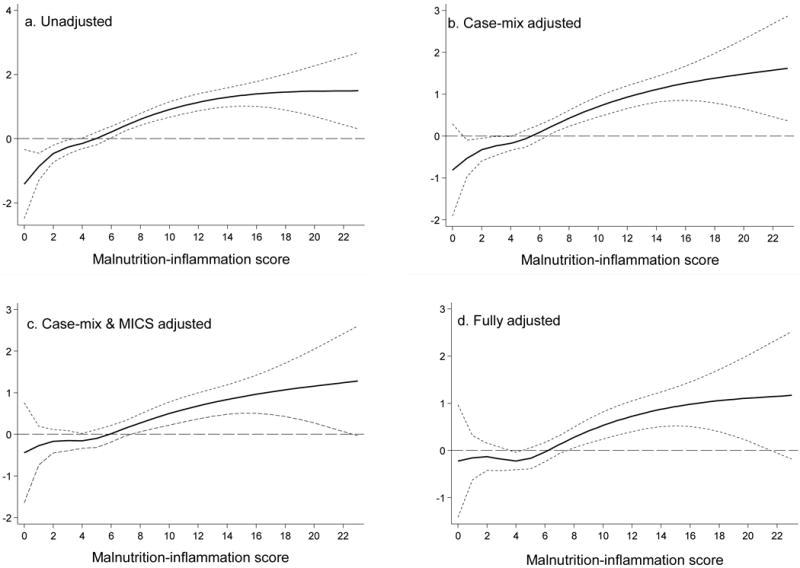
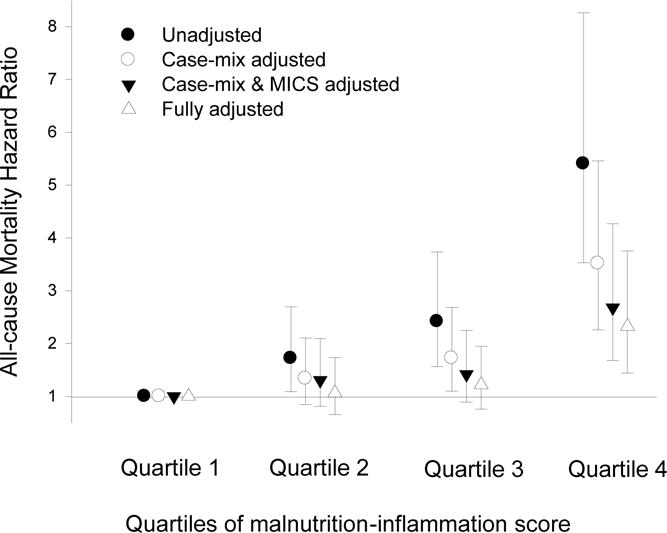
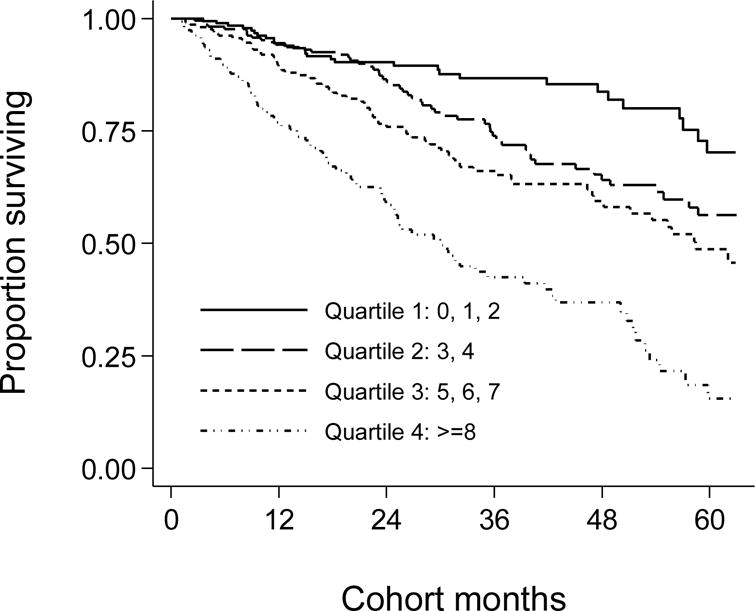
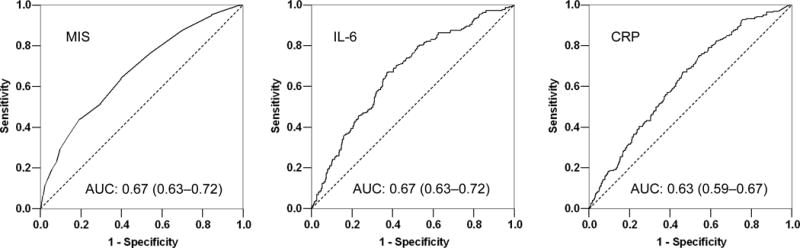
Results: The MIS correlated with logarithm of serum interleukin 6 level (r = +0.26; P < 0.001), logarithm of C-reactive protein level (r = +0.16; P < 0.001), and several measures of nutritional status. Patients with a higher MIS had lower SF-36 scores. After multivariate adjustment for case-mix and other measures of PEW, HD patients in the second (3 to 4), third (5 to 7), and fourth (>or=8) quartiles of MIS had worse survival rates than those in the first (0 to 2) quartile (P < 0.001). Each 2-unit increase in MIS was associated with a 2-fold greater death risk, ie, adjusted death hazard ratio of 2.03 (95% confidence interval, 1.76 to 2.33; P < 0.001). Cubic spline survival models confirmed linear trends. Adding MIS to the constellation of age, sex, race/ethnicity, and vintage significantly improved the area under the receiver operating characteristic curve developed for predicting mortality (0.71 versus 0.67; P < 0.001).
Limitations: Selection bias and unknown confounders.
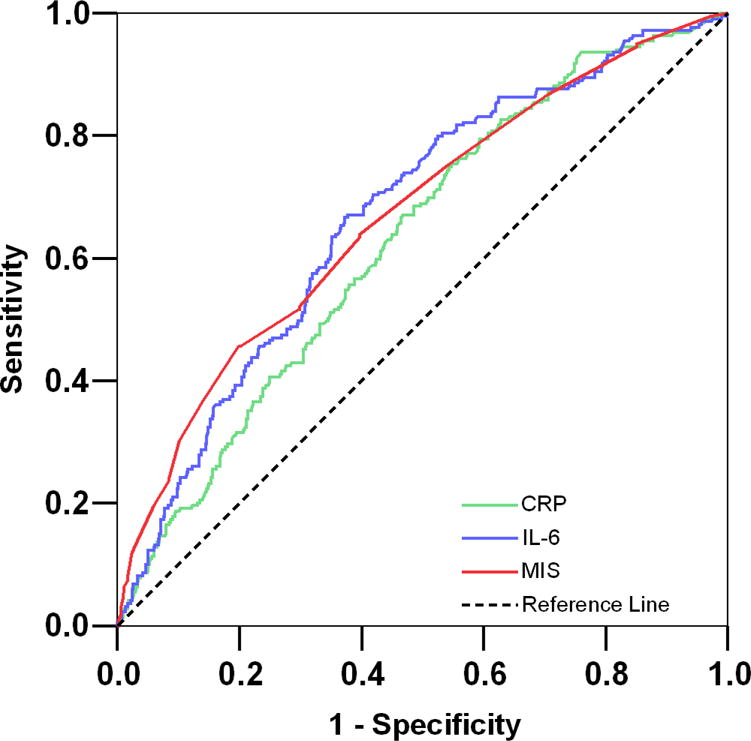
Conclusions: In HD patients, the MIS is associated with inflammation, nutritional status, quality of life, and 5-year prospective mortality. The mortality predictability of the MIS appears equal to serum interleukin 6 and somewhat greater than C-reactive protein levels. Controlled trials are warranted to examine whether interventions to improve the MIS can also improve clinical outcomes in HD patients.
Conflict of interest statement
Figures
References
-
- Clinical practice guidelines for nutrition in chronic renal failure. K/DOQI, National Kidney Foundation. Am J Kidney Dis. 2000;35:S1–S140. - PubMed
-
- Fouque D, Kalantar-Zadeh K, Kopple J, Cano N, Chauveau P, Cuppari L, et al. A proposed nomenclature and diagnostic criteria for protein-energy wasting in acute and chronic kidney disease. Kidney Int. 2008;73(4):391–398. - PubMed
-
- Kalantar-Zadeh K. Recent advances in understanding the malnutrition-inflammation-cachexia syndrome in chronic kidney disease patients: What is next? Semin Dial. 2005;18(5):365–369. - PubMed
-
- Kalantar-Zadeh K, Kopple JD, Block G, Humphreys MH. A malnutrition-inflammation score is correlated with morbidity and mortality in maintenance hemodialysis patients. Am J Kidney Dis. 2001;38(6):1251–1263. - PubMed
-
- Elsurer R, Afsar B, Sezer S, Arat Z, Ozdemir FN, Haberal M. Malnutrition inflammation score is associated with coronary artery disease in hepatitis C virus-infected hemodialysis patients. Eur J Clin Nutr. 2007 - PubMed
Publication types
MeSH terms
Substances
Grants and funding
LinkOut - more resources
Full Text Sources
Medical
Research Materials
