

Hemodynamic changes in the infant cortex during the processing of featural and spatiotemporal information
- PMID: 19071143
- PMCID: PMC2705971
- DOI: 10.1016/j.neuropsychologia.2008.11.014
Hemodynamic changes in the infant cortex during the processing of featural and spatiotemporal information
Abstract
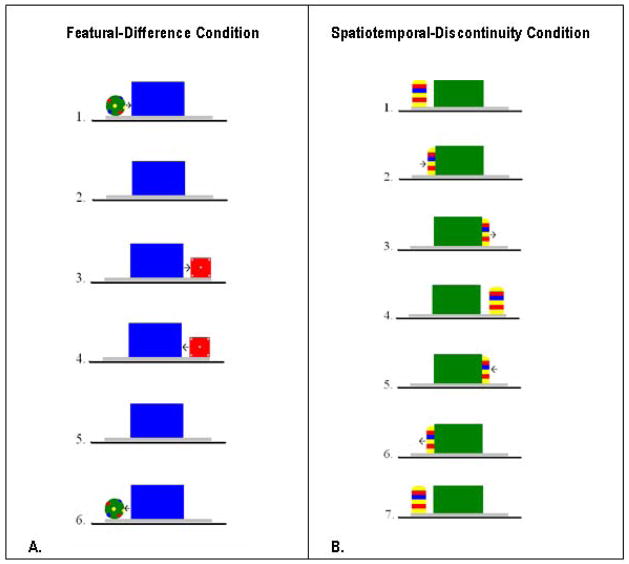
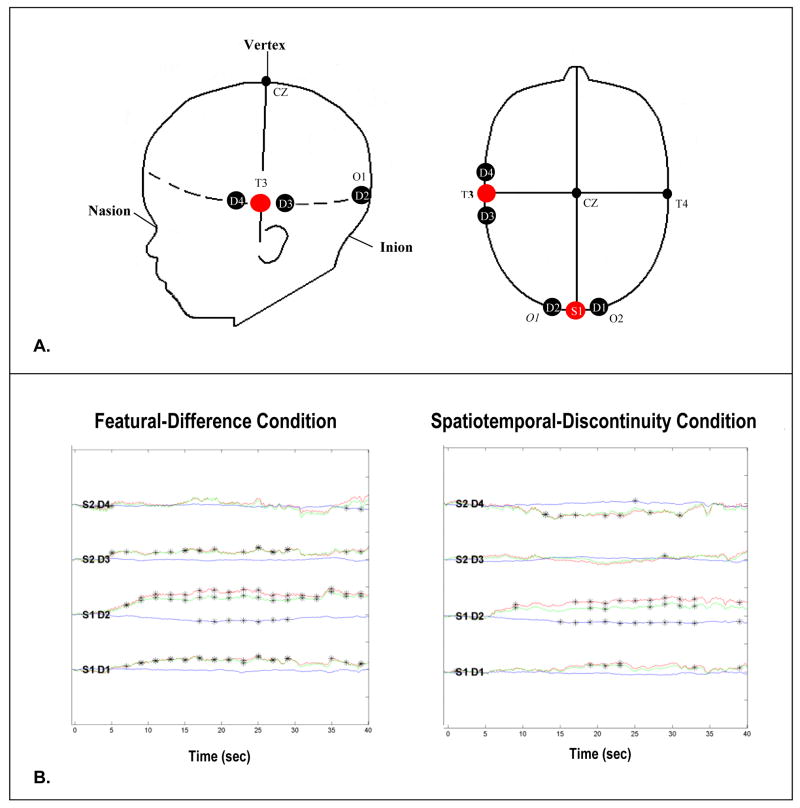
Over the last 20 years neuroscientists have learned a great deal about the ventral and dorsal object processing pathways in the adult brain, yet little is known about the functional development of these pathways. The present research assessed the extent to which different patterns of neural activation, as measured by changes in blood volume and oxygenation, are observed in infant visual and temporal cortex in response to events that involve processing of featural differences or spatiotemporal discontinuities. Infants aged 6.5 months were tested. Increased neural activation was observed in visual cortex in response to a featural-difference and a spatiotemporal-discontinuity event. In addition, increased neural activation was observed in temporal cortex in response to the featural-difference but not the spatiotemporal-discontinuity event. The outcome of this experiment reveals early functional specialization of temporal cortex and lays the foundation for future investigation of the maturation of object processing pathways in humans.
Figures
Similar articles
-
Using near-infrared spectroscopy to assess neural activation during object processing in infants.J Biomed Opt. 2005 Jan-Feb;10(1):11010. doi: 10.1117/1.1852551. J Biomed Opt. 2005. PMID: 15847576 Free PMC article.
-
Dissociation of processing of featural and spatiotemporal information in the infant cortex.Neuroimage. 2010 Dec;53(4):1256-63. doi: 10.1016/j.neuroimage.2010.06.064. Epub 2010 Jul 13. Neuroimage. 2010. PMID: 20603218 Free PMC article.
-
Hemodynamic response to featural changes in the occipital and inferior temporal cortex in infants: a preliminary methodological exploration.Dev Sci. 2008 May;11(3):361-70. doi: 10.1111/j.1467-7687.2008.00681.x. Dev Sci. 2008. PMID: 18466370 Free PMC article.
-
Fine-scale spatial organization of face and object selectivity in the temporal lobe: do functional magnetic resonance imaging, optical imaging, and electrophysiology agree?J Neurosci. 2008 Nov 12;28(46):11796-801. doi: 10.1523/JNEUROSCI.3799-08.2008. J Neurosci. 2008. PMID: 19005042 Free PMC article. Review.
-
Dissociating top-down attentional control from selective perception and action.Neuropsychologia. 2001;39(12):1277-91. doi: 10.1016/s0028-3932(01)00117-8. Neuropsychologia. 2001. PMID: 11566311 Review.
Cited by
-
Neuroimaging with near-infrared spectroscopy demonstrates speech-evoked activity in the auditory cortex of deaf children following cochlear implantation.Hear Res. 2010 Dec 1;270(1-2):39-47. doi: 10.1016/j.heares.2010.09.010. Epub 2010 Oct 1. Hear Res. 2010. PMID: 20888894 Free PMC article.
-
Children's neural activity during number line estimations assessed by functional near-infrared spectroscopy (fNIRS).Brain Cogn. 2020 Oct;144:105601. doi: 10.1016/j.bandc.2020.105601. Epub 2020 Jul 30. Brain Cogn. 2020. PMID: 32739744 Free PMC article.
-
fNIRS in the developmental sciences.Wiley Interdiscip Rev Cogn Sci. 2015 May-Jun;6(3):263-83. doi: 10.1002/wcs.1343. Epub 2015 Feb 23. Wiley Interdiscip Rev Cogn Sci. 2015. PMID: 26263229 Free PMC article. Review.
-
Role of Prefrontal Cortex in Learning and Generalizing Hierarchical Rules in 8-Month-Old Infants.J Neurosci. 2016 Oct 5;36(40):10314-10322. doi: 10.1523/JNEUROSCI.1351-16.2016. J Neurosci. 2016. PMID: 27707968 Free PMC article.
-
Hemodynamic correlates of cognition in human infants.Annu Rev Psychol. 2015 Jan 3;66:349-79. doi: 10.1146/annurev-psych-010213-115108. Epub 2014 Sep 22. Annu Rev Psychol. 2015. PMID: 25251480 Free PMC article. Review.
References
-
- Bachevalier J, Brickson M, Hagger C, Mishkin M. Age and sex differences in the effects of selective temporal lobe lesion on the formation of visual discrimination habits in rhesus monkeys (macaca mulatta) Behavioral Neuroscience. 1990;104:885–899. - PubMed
-
- Baird AA, Kagan J, Gaudette T, Walz KA, Hershlag N, Boas DA. Frontal lobe activation during object permanence: Data from near-infrared spectroscopy. NeuroImage. 2002;16:1120–1126. - PubMed
-
- Bartocci M, Winberg J, Ruggiero C, Bergqvist LL, Serra G, Lagercrantz H. Activation of olfactory cortex in newborn infants after odor stimulation: A functional near-infrared spectroscopy study. Pediatric Research. 2000;48:18–23. - PubMed
-
- Bly BM, Kosslyn SM. Functional anatomy of object recognition in humans: Evidence from positron emission tomography and functional magnetic resonance imaging. Current Opinion in Neurology. 1997;10:5–9. - PubMed
-
- Boas DA, Franceschini MA, Dunn AK, Strangman G. Noninvasive imaging of cerebral activation with diffuse optical tomography. In: Frostig RD, editor. Vivo Optical Imaging of Brain Function. Boca Raton: CRC Press; 2002. pp. 193–221. 2002. - PubMed
Publication types
MeSH terms
Substances
Grants and funding
LinkOut - more resources
Full Text Sources
