. 2008 Dec 9;6(12):2880-95.
doi: 10.1371/journal.pbio.0060302.

Epigenomic consequences of immortalized plant cell suspension culture

Affiliations

Epigenomic consequences of immortalized plant cell suspension culture

Milos Tanurdzic et al. PLoS Biol. .

Abstract

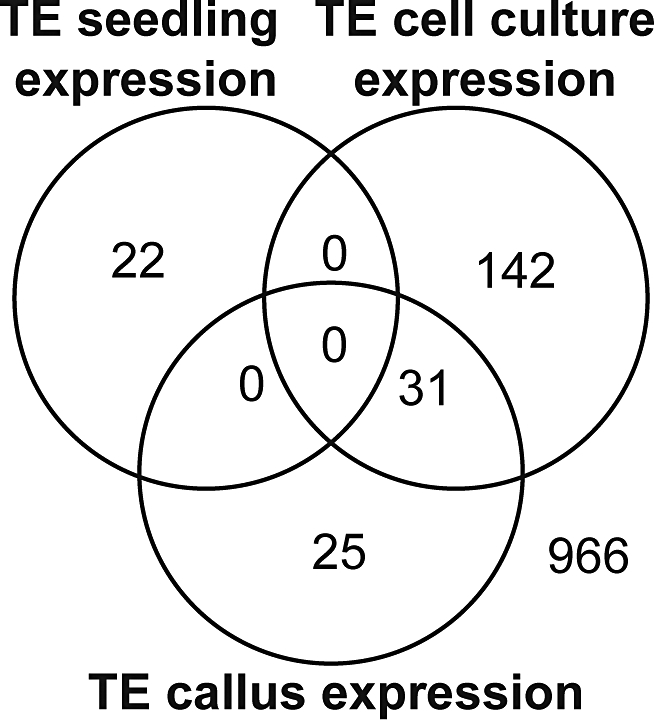
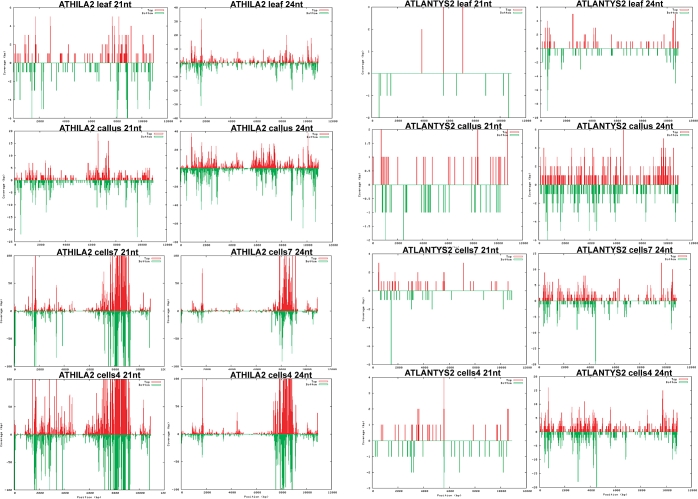
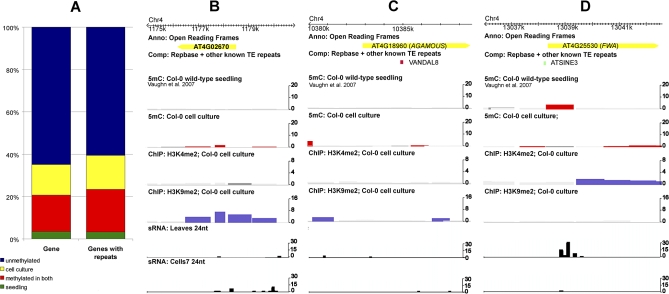
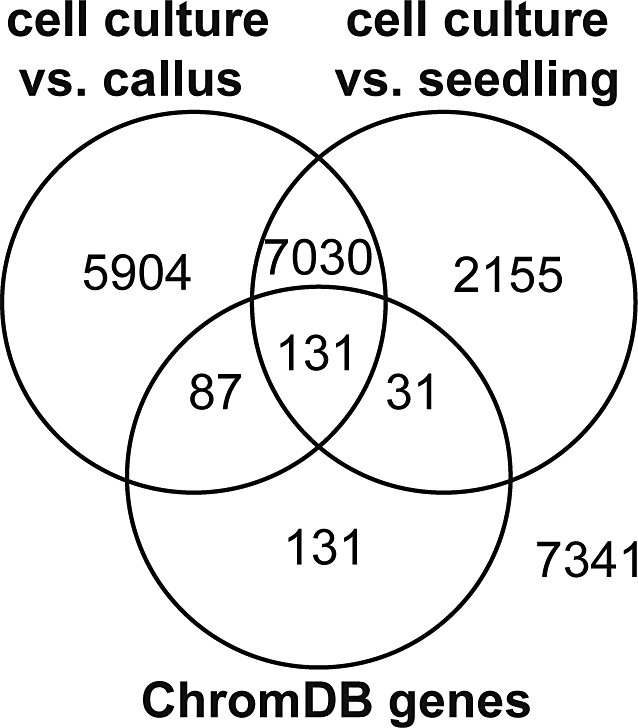
Plant cells grown in culture exhibit genetic and epigenetic instability. Using a combination of chromatin immunoprecipitation and DNA methylation profiling on tiling microarrays, we have mapped the location and abundance of histone and DNA modifications in a continuously proliferating, dedifferentiated cell suspension culture of Arabidopsis. We have found that euchromatin becomes hypermethylated in culture and that a small percentage of the hypermethylated genes become associated with heterochromatic marks. In contrast, the heterochromatin undergoes dramatic and very precise DNA hypomethylation with transcriptional activation of specific transposable elements (TEs) in culture. High throughput sequencing of small interfering RNA (siRNA) revealed that TEs activated in culture have increased levels of 21-nucleotide (nt) siRNA, sometimes at the expense of the 24-nt siRNA class. In contrast, TEs that remain silent, which match the predominant 24-nt siRNA class, do not change significantly in their siRNA profiles. These results implicate RNA interference and chromatin modification in epigenetic restructuring of the genome following the activation of TEs in immortalized cell culture.


Conflict of interest statement

Competing interests. The authors have declared that no competing interests exist.

Figures

Figure 1
Figure 1. Heterochromatic Modification of Chromosome 4 in Arabidopsis Cell Suspension Cultures
One megabase encompassing the heterochromatic knob on the short arm of chromosome 4 and the flanking euchromatic region are displayed. Genes are depicted in yellow, DNA transposons are in red and orange, and retrotransposons are in green in the annotation (Anno) and Repbase tracks (Comp). DNA methylation profiles of cell suspension culture and the reference Col seedling DNA methylation profile [51] are presented as red bars. Tiles with significant enrichment of H3K4me2 and H3K9me2 are shown in purple, while those tiles associated with H3K56ac are shown in green. A 100-bp–resolution sliding window analysis of sRNA frequencies, corrected for sRNA library size and genomic copy number, for 21- and 24-nt size fractions is shown.
Figure 2
Figure 2. TE Expression Differences between Cell Suspension Culture, Seedling, and Callus Tissues
A Venn diagram of transcripts with significant TE homology that show significant overaccumulation (normalized value ≥ 1.5) in ATH1-based microarray expression profiles of cell suspension culture, seedling, and callus samples. There is no overlap between samples and a much higher degree of TE activity in cell suspension culture.
Figure 3
Figure 3. Size Distribution of sRNA Sequences in Cell Suspension Culture (Cells4 and Cells7), Col-0 Leaves, and Col-0 Callus
The relative frequencies of all sRNAs (with all known miRNA sequences removed) according to their size for each of the small RNA libraries, as well as only for those sRNAs matching particular families of Arabidopsis repeats (AR12, Athila, Atlantys, Helitron, AtGP1, AtMu, AtENSPM, AtCopia, and AtVandal).
Figure 4
Figure 4. Spatial Distribution and Frequency of sRNA Sequences for Athila and Atlantys Retrotransposons in the Leaf, Callus, and the Cell Suspension Culture (Cells7 and Cells4) Libraries
A representative full-length Athila2 and Atlantys2 TE from chromosome 4 was used as a sequence-matching template to map 21-nt and 24-nt sRNAs with perfect matches, resulting in single-nucleotide coverage of the template sequences. The coverage was plotted on the y-axis, for both DNA strands (top strand in red and the bottom strand in green), ranging from 0 to 6, 20, 100, and 100 for Athila2 21-nt matches, respectively, and from 0 to 40, 40, 100, and 100 for the Athila2 24-nt matches; and from 0 to 3, 2, 4, and 4 for the Atlantys2 21-nt matches, and from 0 to 6, 6, 15, and 20 for Atlantys2 24-nt matches, respectively. The x-axis represents the template sequence in the 5′ to 3′ direction, ranging from 0 to 12,000 bp.
Figure 5
Figure 5. Euchromatic Modification of Chromosome 4 in Arabidopsis Cell Suspension Cultures
(A) The number of genic array tiles with no repeat homology detecting significant methylation, H3K56ac, H3K9me2, and H3K4me2 in suspension cell culture was calculated at 10% intervals relative to the length of each gene, and compared with the number expected if these modifications were randomly distributed. Parallel computations were done for leaf H3K4me2 and H3K9me2, and data for seedling DNA methylation were imported from previously published work [51]. (B) Chromatin maps of an approximately 87-kb region of euchromatin from the short arm of chromosome 4. Whereas genic DNA methylation patterns are similar between the cell suspension culture and seedlings [51], H3K9me2 is almost completely lacking from this region. Instead, gene coding regions are enriched in H3K4me2, and this pattern is interrupted by H3K56ac-enriched promoter regions preceding the coding regions in an intercalated pattern.
Figure 6
Figure 6. Genic Methylation and Epiallele Formation in Arabidopsis Cell Suspension Culture
(A) Genic methylation changes between seedling and cell suspension culture (percentage of chromosome 4 array gene tiles). Green: tiles associated with genic sequences that lose DNA methylation in cell suspension culture; yellow: tiles methylated only in cell suspension culture; red: tiles methylated in both samples; and blue: tiles not methylated in either sample. Chromatin maps of cell suspension culture at the (B) IDD12 (At4g02670), (C) AGAMOUS, and (D) FWA loci. Tiles with DNA methylation are presented as red bars, while those enriched in H3K9me2 and H3K4me2 are shown in purple. Tracks representing the 21-nt and 24-nt sRNA abundance per 100-bp sliding window are shown in black.
Figure 7
Figure 7. Gene Expression Differences between Cell Suspension Culture and Seedling and Callus Tissues
Significant gene expression differences detected by ATH1 microarray expression profiling between cell suspension culture and seedling or callus samples are represented in this Venn diagram. Also, 65% of genes annotated by ChromDB as having a role in chromatin regulation are differentially expressed in these samples relative to seedling.

References

    1. Lee M, Phillips RL. The chromosomal basis of somaclonal variation. Annu Rev Plant Physiol Plant Mol Biol. 1988;39:413–437.
    1. Osborne DJ, Mcmanus MT. Flexibility and commitment in plant cells during development. Curr Top Dev Biol. 1986;20:383–396. - PubMed
    1. Skoog F, Miller CO. Chemical regulation of growth and organ formation in plant tissues cultured in vitro. Symp Soc Exp Biol. 1957;54:118–130. - PubMed
    1. Meins F. Habituation: heritable variation in the requirement of cultured plant-cells for hormones. Annu Rev Genet. 1989;23:395–408. - PubMed
    1. Meins F, Foster R. Reversible, cell-heritable changes during the development of tobacco pith tissues. Dev Biol. 1985;108:1–5. - PubMed

Publication types