

Structural characterization of the hemophore HasAp from Pseudomonas aeruginosa: NMR spectroscopy reveals protein-protein interactions between Holo-HasAp and hemoglobin
- PMID: 19072037
- PMCID: PMC2666852
- DOI: 10.1021/bi801860g
Structural characterization of the hemophore HasAp from Pseudomonas aeruginosa: NMR spectroscopy reveals protein-protein interactions between Holo-HasAp and hemoglobin
Abstract
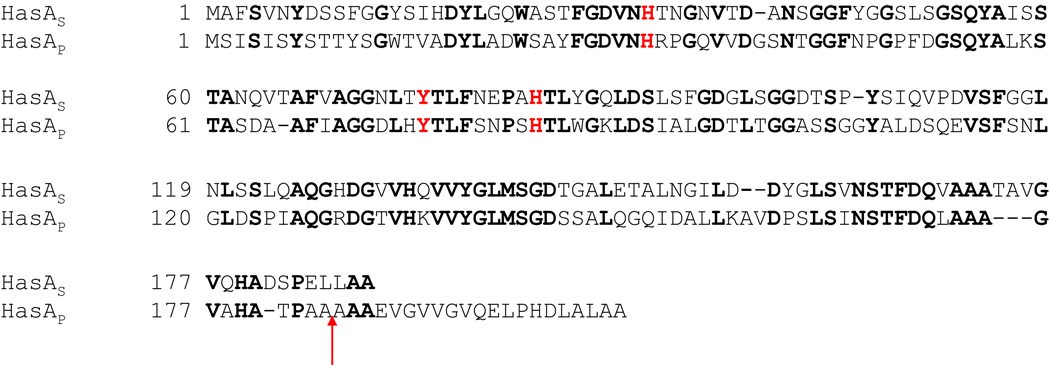
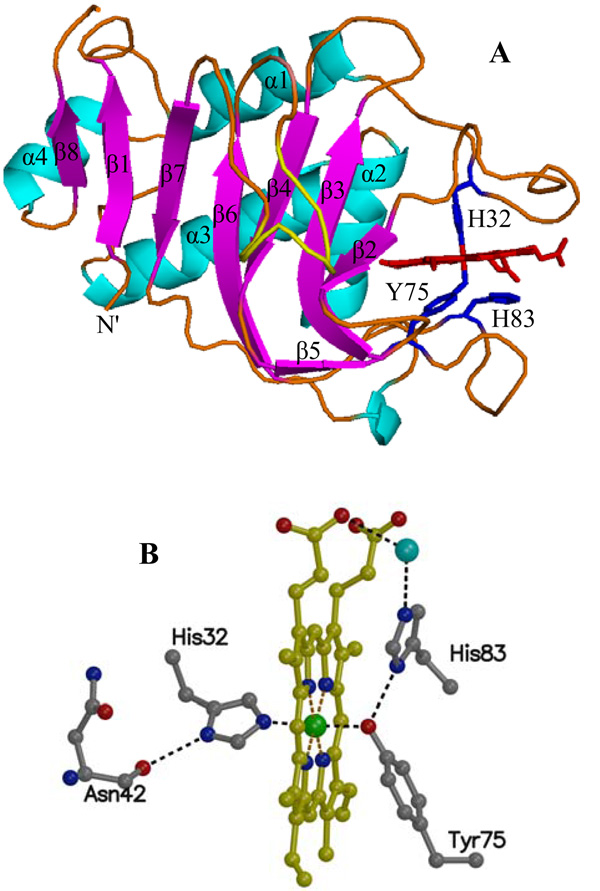
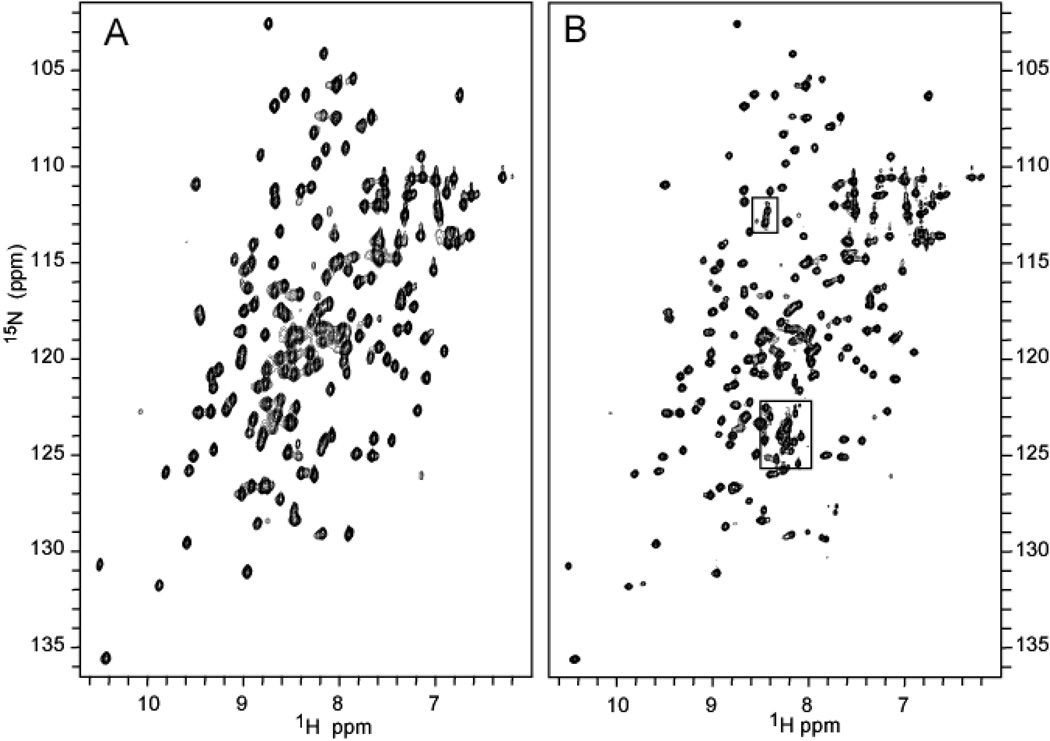
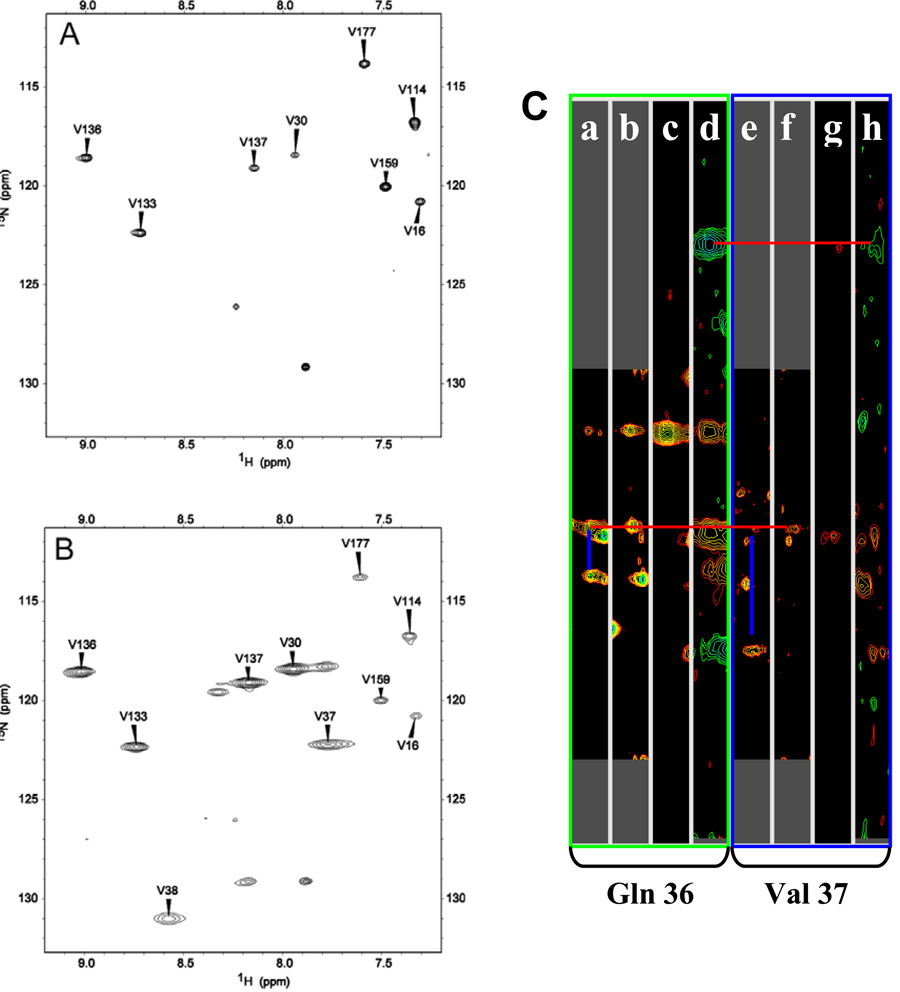
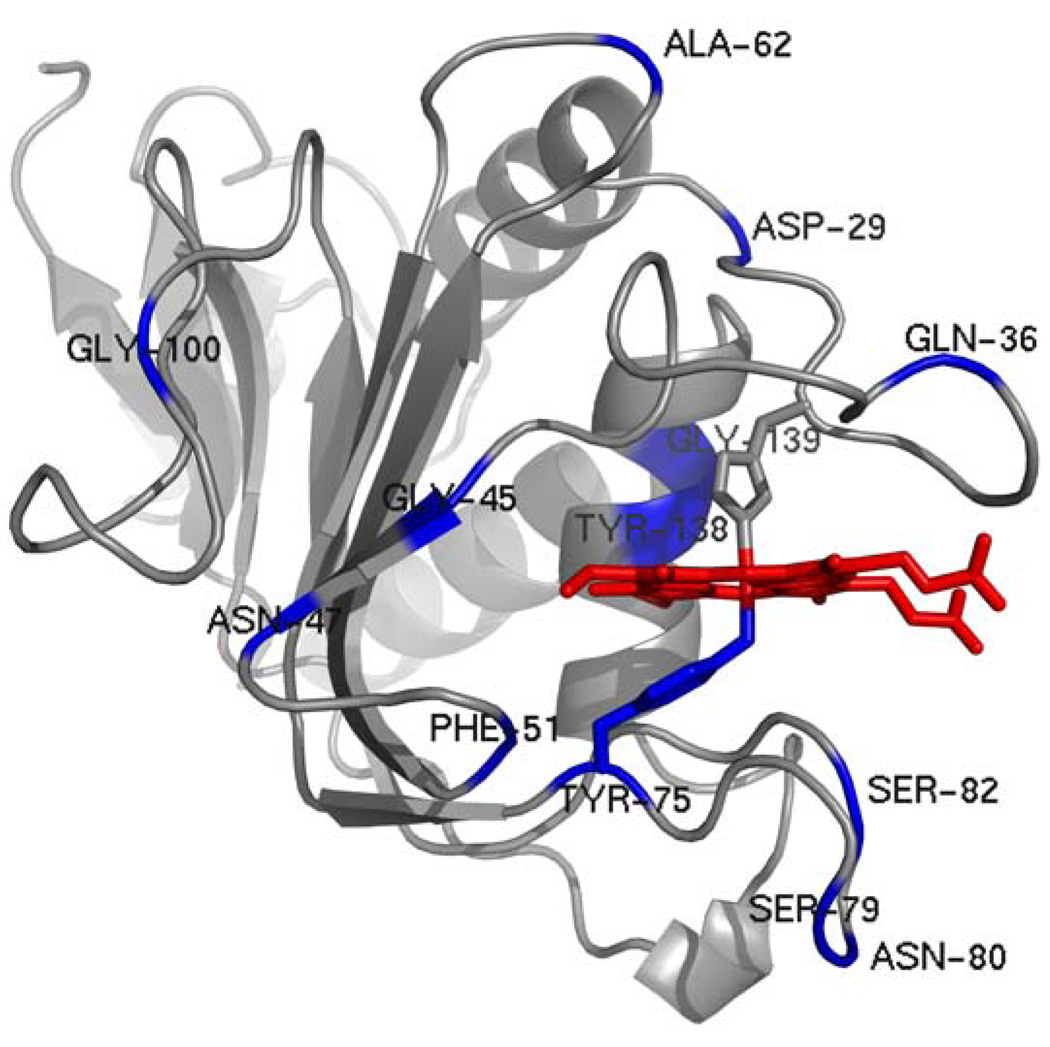
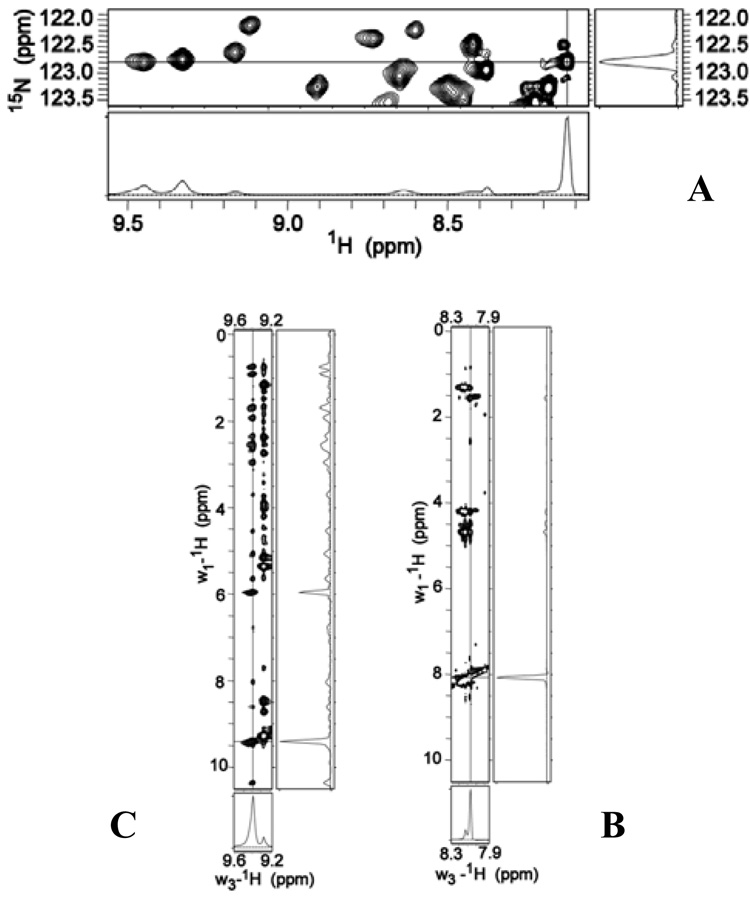
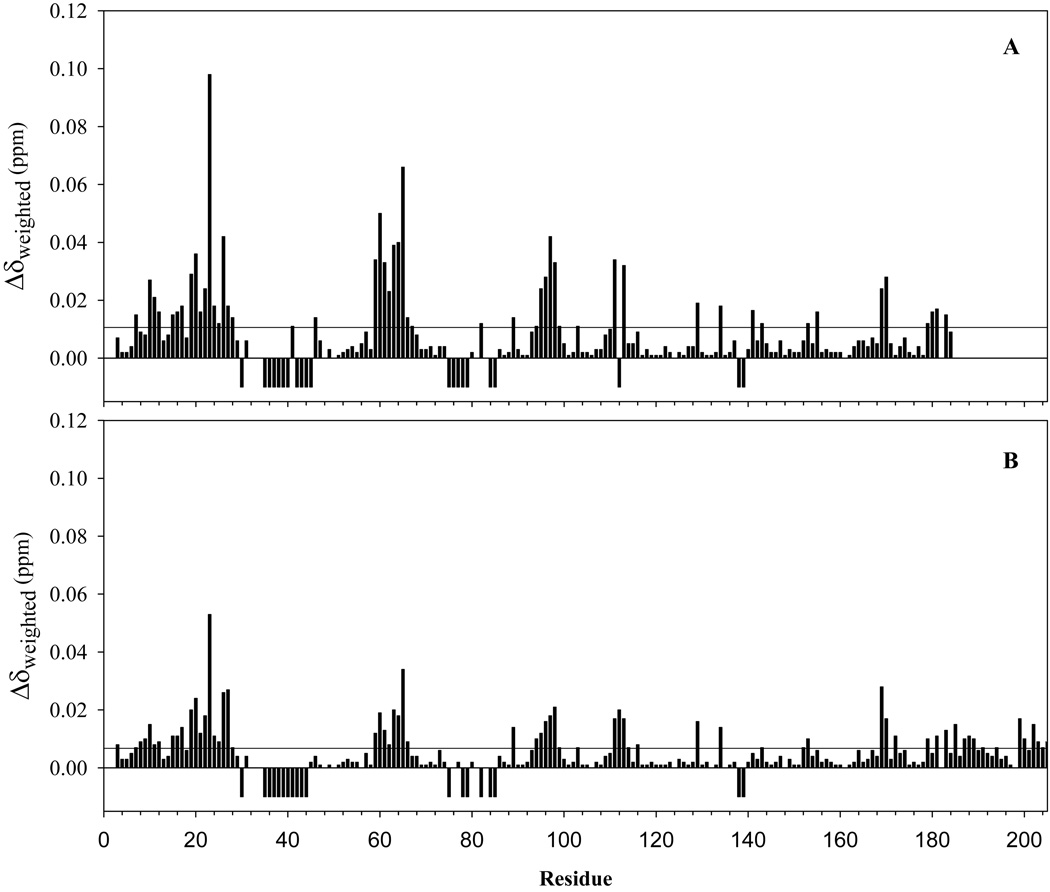
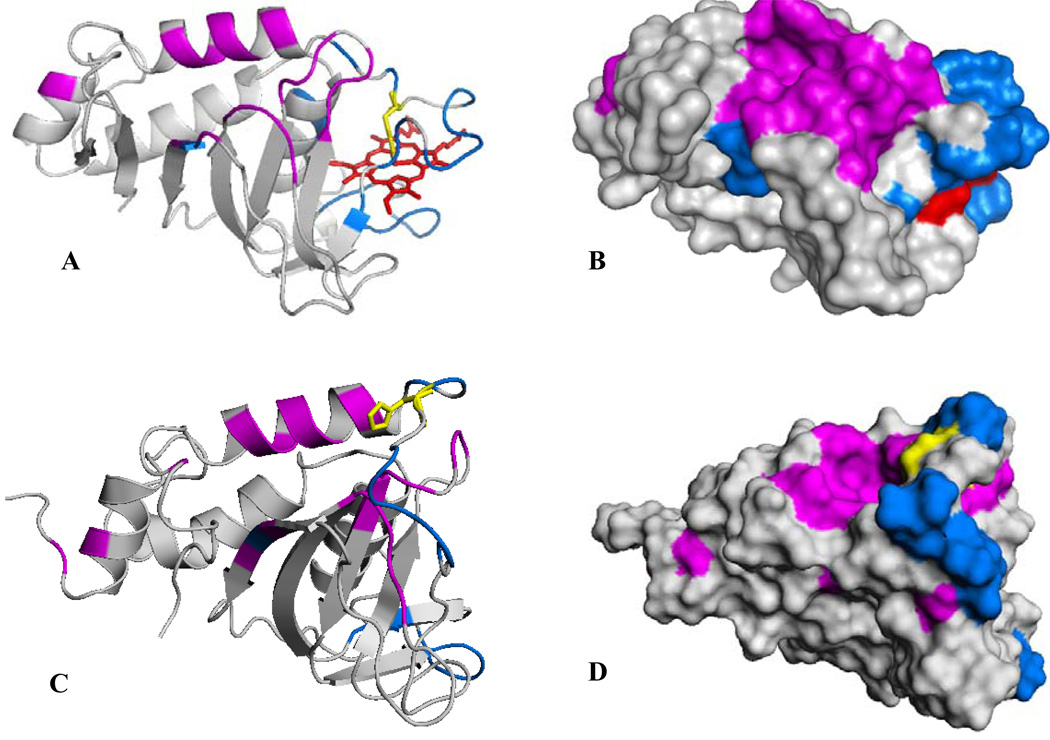
Pseudomonas aeruginosa secretes a 205 residue long hemophore (full-length HasAp) that is subsequently cleaved at the C'-terminal domain to produce mainly a 184 residue long truncated HasAp that scavenges heme [Letoffé, S., Redeker, V., and Wandersman, C. (1998) Mol. Microbiol. 28, 1223-1234]. HasAp has been characterized by X-ray crystallography and in solution by NMR spectroscopy. The X-ray crystal structure of truncated HasAp revealed a polypeptide alphabeta fold and a ferriheme coordinated axially by His32 and Tyr75, with the side chain of His83 poised to accept a hydrogen bond from the Tyr75 phenolic acid group. NMR investigations conducted with full-length HasAp showed that the carboxyl-terminal tail (21 residues) is disordered and conformationally flexible. NMR spectroscopic investigations aimed at studying a complex between apo-HasAp and human methemoglobin were stymied by the rapid heme capture by the hemophore. In an effort to circumvent this problem NMR spectroscopy was used to monitor the titration of 15N-labeled holo-HasAp with hemoglobin. These studies allowed identification of a specific area on the surface of truncated HasAp, encompassing the axial ligand His32 loop that serves as a transient site of interaction with hemoglobin. These findings are discussed in the context of a putative encounter complex between apo-HasAp and hemoglobin that leads to efficient hemoglobin-heme capture by the hemophore. Similar experiments conducted with full-length 15N-labeled HasAp and hemoglobin revealed a transient interaction site in full-length HasAp similar to that observed in the truncated hemophore. The spectral perturbations observed while investigating these interactions, however, are weaker than those observed for the interactions between hemoglobin and truncated HasAp, suggesting that the disordered tail in the full-length HasAp must be proteolyzed in the extracellular milieu to make HasAp a more efficient hemophore.
Figures
Similar articles
-
Replacing the axial ligand tyrosine 75 or its hydrogen bond partner histidine 83 minimally affects hemin acquisition by the hemophore HasAp from Pseudomonas aeruginosa.Biochemistry. 2014 Apr 8;53(13):2112-25. doi: 10.1021/bi500030p. Epub 2014 Mar 26. Biochemistry. 2014. PMID: 24625274 Free PMC article.
-
Structural, NMR spectroscopic, and computational investigation of hemin loading in the hemophore HasAp from Pseudomonas aeruginosa.J Am Chem Soc. 2010 Jul 21;132(28):9857-72. doi: 10.1021/ja103498z. J Am Chem Soc. 2010. PMID: 20572666 Free PMC article.
-
Axial Heme Coordination by the Tyr-His Motif in the Extracellular Hemophore HasAp Is Critical for the Release of Heme to the HasR Receptor of Pseudomonas aeruginosa.Biochemistry. 2021 Aug 24;60(33):2549-2559. doi: 10.1021/acs.biochem.1c00389. Epub 2021 Jul 29. Biochemistry. 2021. PMID: 34324310 Free PMC article.
-
Heme acquisition by hemophores.Biometals. 2007 Jun;20(3-4):603-13. doi: 10.1007/s10534-006-9050-y. Epub 2007 Feb 1. Biometals. 2007. PMID: 17268821 Review.
-
Sterol carrier protein-2: structure reveals function.Cell Mol Life Sci. 2002 Feb;59(2):193-212. doi: 10.1007/s00018-002-8416-8. Cell Mol Life Sci. 2002. PMID: 11915938 Free PMC article. Review.
Cited by
-
Unique structure and stability of HmuY, a novel heme-binding protein of Porphyromonas gingivalis.PLoS Pathog. 2009 May;5(5):e1000419. doi: 10.1371/journal.ppat.1000419. Epub 2009 May 8. PLoS Pathog. 2009. PMID: 19424422 Free PMC article.
-
Spectroscopic Determination of Distinct Heme Ligands in Outer-Membrane Receptors PhuR and HasR of Pseudomonas aeruginosa.Biochemistry. 2015 Apr 28;54(16):2601-12. doi: 10.1021/acs.biochem.5b00017. Epub 2015 Apr 17. Biochemistry. 2015. PMID: 25849630 Free PMC article.
-
Draft Genome Sequence of Pseudomonas fluorescens LMG 5329, a White Line-Inducing Principle-Producing Bioindicator for the Mushroom Pathogen Pseudomonas tolaasii.Genome Announc. 2013 Jul 25;1(4):e00383-13. doi: 10.1128/genomeA.00383-13. Genome Announc. 2013. PMID: 23887909 Free PMC article.
-
Characterization of a heme-regulated non-coding RNA encoded by the prrF locus of Pseudomonas aeruginosa.PLoS One. 2010 Apr 8;5(4):e9930. doi: 10.1371/journal.pone.0009930. PLoS One. 2010. PMID: 20386693 Free PMC article.
-
The peculiar heme pocket of the 2/2 hemoglobin of cold-adapted Pseudoalteromonas haloplanktis TAC125.J Biol Inorg Chem. 2011 Feb;16(2):299-311. doi: 10.1007/s00775-010-0726-y. Epub 2010 Nov 13. J Biol Inorg Chem. 2011. PMID: 21076847
References
-
- Wandersman C, Stojiljkovic I. Bacterial Heme Sources: The Role of Heme, Hemoprotein Receptors and Hemophores. Curr. Oppin. Microbiology. 2000;3:215–220. - PubMed
-
- Genco CA, Dixon DW. Emerging Strategies in Microbial Haem Capture. Mol. Microbiol. 2001;39:1–11. - PubMed
-
- Ochsner UA, Johnson Z, Vasil AI. Genetics and Regulation of Two Distinct Haem-Uptake Systems, phu and has in Pseudomonas aeruginosa. Microbiology. 2000;146:185–198. - PubMed
-
- Wandersman C, Delepelaire P. Bacterial Iron Sources: From Siderophores to Hemophores. Annu. Rev. Microbiol. 2004;58:611–647. - PubMed
Publication types
MeSH terms
Substances
Associated data
- Actions
Grants and funding
LinkOut - more resources
Full Text Sources
