

Common pharmacophore identification using frequent clique detection algorithm
- PMID: 19072298
- PMCID: PMC2631088
- DOI: 10.1021/ci8002478
Common pharmacophore identification using frequent clique detection algorithm
Abstract
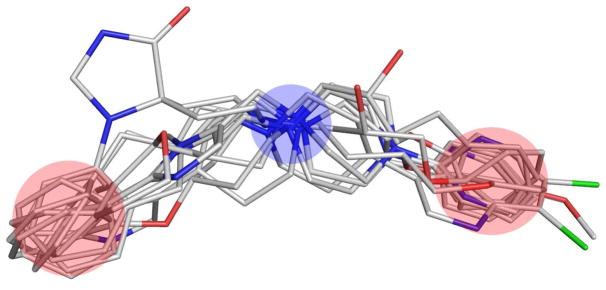
The knowledge of a pharmacophore, or the 3D arrangement of features in the biologically active molecule that is responsible for its pharmacological activity, can help in the search and design of a new or better drug acting upon the same or related target. In this paper, we describe two new algorithms based on the frequent clique detection in the molecular graphs. The first algorithm mines all frequent cliques that are present in at least one of the conformers of each (or a portion of all) molecules. The second algorithm exploits the similarities among the different conformers of the same molecule and achieves an order of magnitude performance speedup compared to the first algorithm. Both algorithms are guaranteed to find all common pharmacophores in the data set, which is confirmed by the validation on the set of molecules for which pharmacophores have been determined experimentally. In addition, these algorithms are able to scale to data sets with arbitrarily large number of conformers per molecule and identify multiple ligand binding modes or multiple binding sites of the target.
Figures


References
-
- Güner OF, editor. Pharmacophore Perception, Development, and Use in Drug Design. International University Line; LaJolla, CA: 2000.
-
- Langer T, Hoffmann RD, editors. Pharmacophores and Pharmacophore Searches. Wiley-VCH; Weinheim: 2006.
-
- Eglen RM, Schneider G, Böhm H-J. High-Thoughput Screening and Virtual Screening: Entry Points to Drug Discovery. In: Böhm H-J, Schneider G, editors. Virtual Screening for Bioactive Molecules. Wiley-VCH; Weinheim: 2000. pp. 1–14.
-
- VanDrie JH. Future Directions in Pharmacophore Discovery. In: Güner OF, editor. Pharmacophore Perception, Development, and Use in Drug Design. International University Line; La Jolla, CA: 1999. pp. 515–530.
-
- Martin YC, Bures MG, Danaher EA, De-Lazzer J, Lico I, Pavlik PA. A fast new approach to pharmacophore mapping and its application to dopaminergic and benzodiazepine agonists. J Comput-Aided Mol Des. 1993;7:83–102. - PubMed
Publication types
MeSH terms
Substances
Grants and funding
LinkOut - more resources
Full Text Sources
Medical
