. 2009 Jan 15;81(2):557-66.
doi: 10.1021/ac801609r.

Comprehensive defensin assay for saliva

Affiliations

Comprehensive defensin assay for saliva

Michael S Gardner et al. Anal Chem. .

Abstract

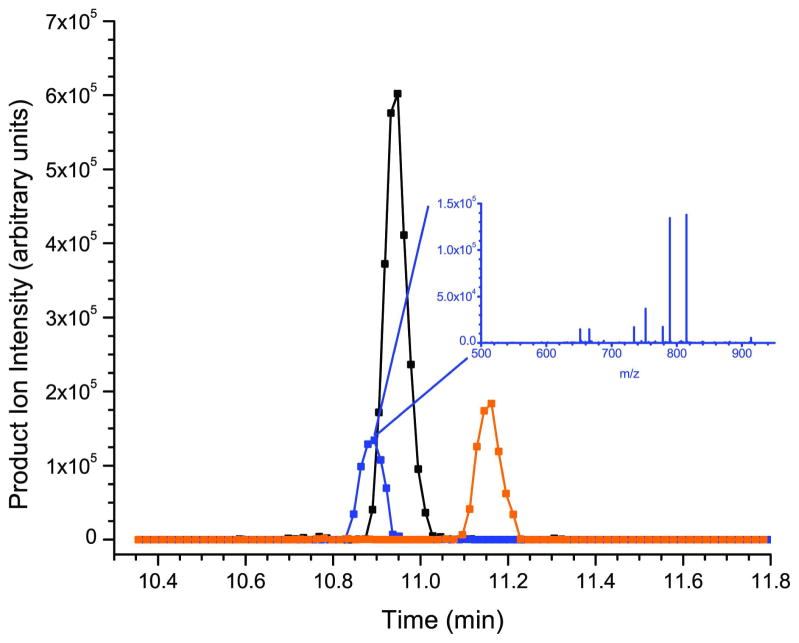
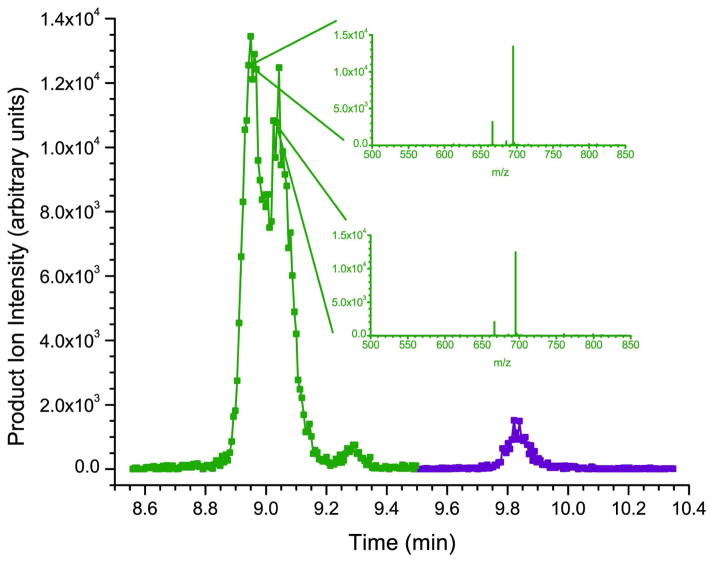
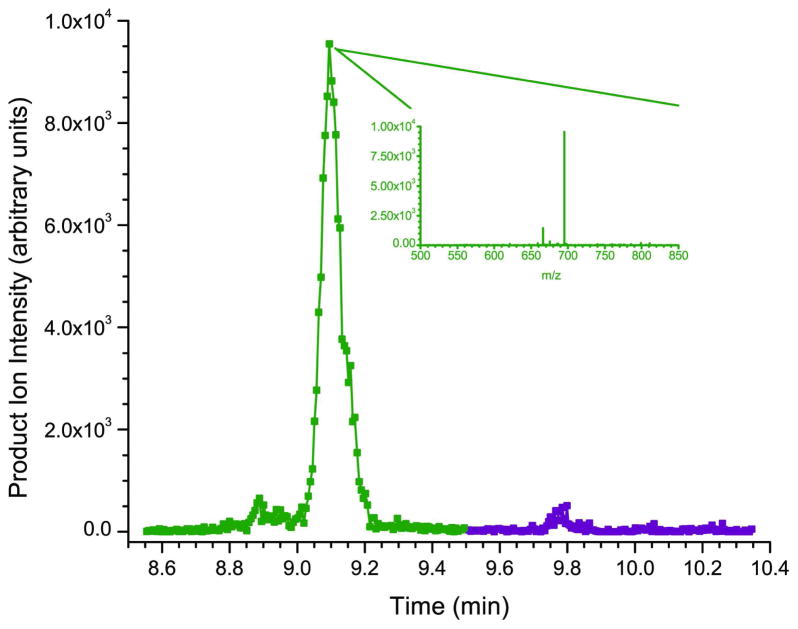
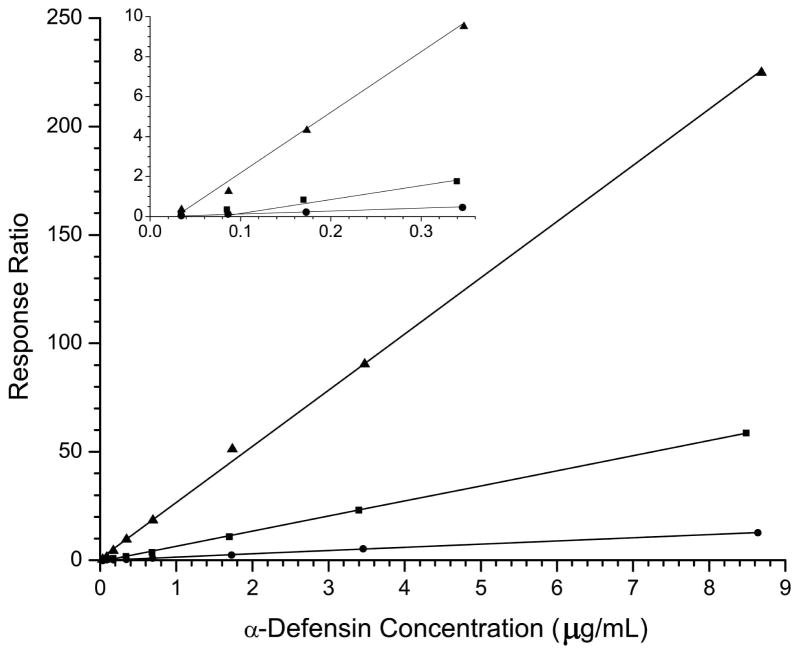
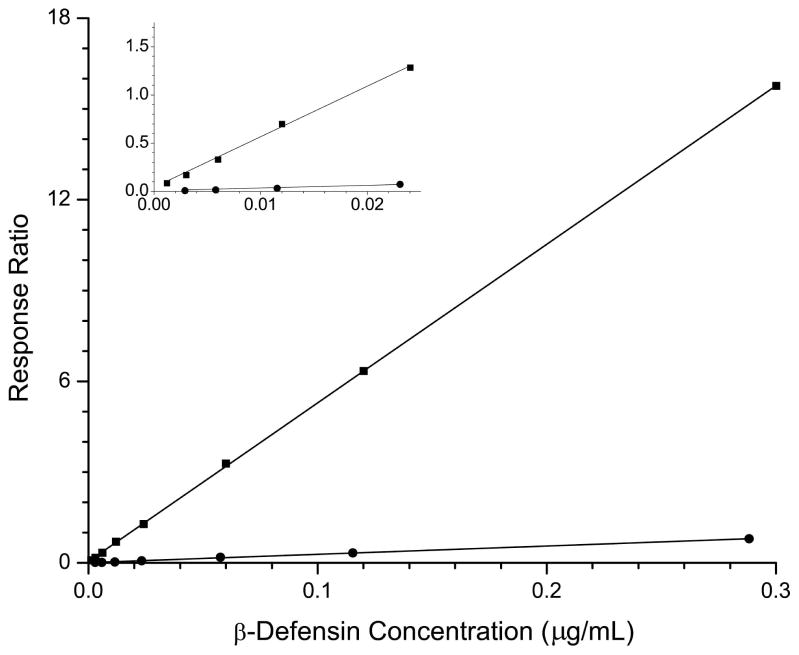
Defensins are highly basic cationic peptides that are important components of the innate and adaptive immune response pathways. In addition, these peptides are involved in CD8+ T cell response to HIV-1, increased pulmonary infection risk among cystic fibrosis patients, upregulated levels of HNP-5 for patients with ulcerative colitis and Crohn's disease, and monitoring HNP-3 levels as a tumor classification scheme for cutaneous T cell lymphomas, and have promise in the pharmaceutical field as a new class of antibiotics. Here we present a parallel assay for the alpha (HNP1-3) and beta (HBD1-2) classes of defensins in saliva that are naturally observed in the concentration range of 1 ng/mL to 10 microg/mL. The method utilizes solid phase extraction of saliva samples combined with liquid chromatography-tandem mass spectrometry to identify and quantitate defensin targets. The approach involves limited sample manipulation and is easily amenable to automation. The saliva samples analyzed are derived from a large cohort study focused on examining the role of polymorphisms in genes of innate and adaptive immunity in modulating the response to vaccination for two gastrointestinal tract infections: typhoid and cholera. The alpha-defensin levels observed range from 1 to 10 microg/mL and correlate well with known active concentrations against a wide variety of pathogens. The observed concentration range for beta-defensins was between the detection limit and 33 ng/mL and had a sensitivity level that was comparable to immunoassay-based detection. This method is easily adapted for use in a clinical immunology setting and can be modified for other biological matrixes. This assay will facilitate examination of the production, secretion, and regulation of defensin peptides in a direct fashion to coordinate levels of these compounds with gender, age, response to vaccination, gene copy number, and oral health.


Figures

Figure 1
Figure 1
Mass spectrometric fragmentation patterns of the five defensin targets for the saliva assay. Due to the highly basic nature of these peptides, fragmentation is limited to only a few dissociation routes which results in improved signal-to-noise for absolute quantitation. The product ions used for quantitative purposes are highlighted in the box. a) HNP-1 b) HNP-2 c) HNP-3 d) HBD-1 e) HBD-2.
Figure 1
Figure 1
Mass spectrometric fragmentation patterns of the five defensin targets for the saliva assay. Due to the highly basic nature of these peptides, fragmentation is limited to only a few dissociation routes which results in improved signal-to-noise for absolute quantitation. The product ions used for quantitative purposes are highlighted in the box. a) HNP-1 b) HNP-2 c) HNP-3 d) HBD-1 e) HBD-2.
Figure 2
Figure 2
a) Response of HNP-2 as a function of the concentration of the carrier protein lysozyme. b) Individual calibration curves for HNP-2 with (○) and without (□) a 1 mg/mL of the carrier protein lysozyme present c) Calibration curves for HNP-2 using lysozyme treated vials (□), treated vials after 48 hours (△), and untreated vials (○).
Figure 2
Figure 2
a) Response of HNP-2 as a function of the concentration of the carrier protein lysozyme. b) Individual calibration curves for HNP-2 with (○) and without (□) a 1 mg/mL of the carrier protein lysozyme present c) Calibration curves for HNP-2 using lysozyme treated vials (□), treated vials after 48 hours (△), and untreated vials (○).
Figure 3
Figure 3
a) Chromatographic profile of the product ion intensity for synthetic HNP-1, HNP-2, and HNP-3. The inset shows the tandem mass spectrum of the peptide at two different points across the peak for HNP-2. b) Chromatographic profile of the product ion intensity for naturally occurring (saliva sample) HNP-1, HNP-2, and HNP-3. c) Chromatographic profile of the product ion intensity for synthetic HBD-1, and HBD-2. The inset shows the tandem mass spectrum of the peptide at two different points across the peak for HBD-2. d) Chromatographic profile of the product ion intensity for naturally occurring (saliva sample) HBD-1, and HBD-2.
Figure 3
Figure 3
a) Chromatographic profile of the product ion intensity for synthetic HNP-1, HNP-2, and HNP-3. The inset shows the tandem mass spectrum of the peptide at two different points across the peak for HNP-2. b) Chromatographic profile of the product ion intensity for naturally occurring (saliva sample) HNP-1, HNP-2, and HNP-3. c) Chromatographic profile of the product ion intensity for synthetic HBD-1, and HBD-2. The inset shows the tandem mass spectrum of the peptide at two different points across the peak for HBD-2. d) Chromatographic profile of the product ion intensity for naturally occurring (saliva sample) HBD-1, and HBD-2.
Figure 4
Figure 4
a) Calibration curves for HNP-1 (■), HNP-2 (●), and HNP-3 (▲). In the inset is shown an expanded view of the low concentration region. b) Calibration curves for HBD-1 (●) and HBD-2 (■). The inset shows an expanded view of the low concentration region.
Figure 4
Figure 4
a) Calibration curves for HNP-1 (■), HNP-2 (●), and HNP-3 (▲). In the inset is shown an expanded view of the low concentration region. b) Calibration curves for HBD-1 (●) and HBD-2 (■). The inset shows an expanded view of the low concentration region.

Similar articles

Cited by

References

    1. Abiko Y, Saitoh M. Current Pharmaceutical Design. 2007;13:3065–3072. - PubMed
    1. Abiko Y, Saitoh M, Nishimura M, Yamazaki M, Sawamura D, Kaku T. Medical Molecular Morphology. 2007;40:179–184. - PubMed
    1. Dale BA, Fredericks LP. Current Issues in Molecular Biology. 2005;7:119–133. - PMC - PubMed
    1. Bowdish DME, Davidson DJ, Scott MG, Hancock REW. Antimicrobial Agents And Chemotherapy. 2005;49:1727. - PMC - PubMed
    1. Ganz T. Nature Reviews Immunology. 2003;3:710. - PubMed

Publication types