

Location specific radiographic joint space width for osteoarthritis progression
- PMID: 19073368
- PMCID: PMC3138121
- DOI: 10.1016/j.joca.2008.11.001
Location specific radiographic joint space width for osteoarthritis progression
Abstract
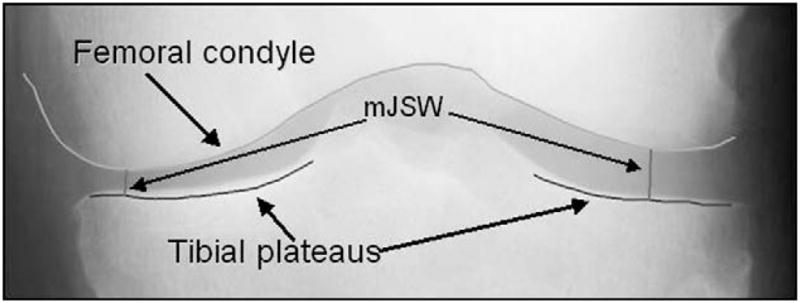
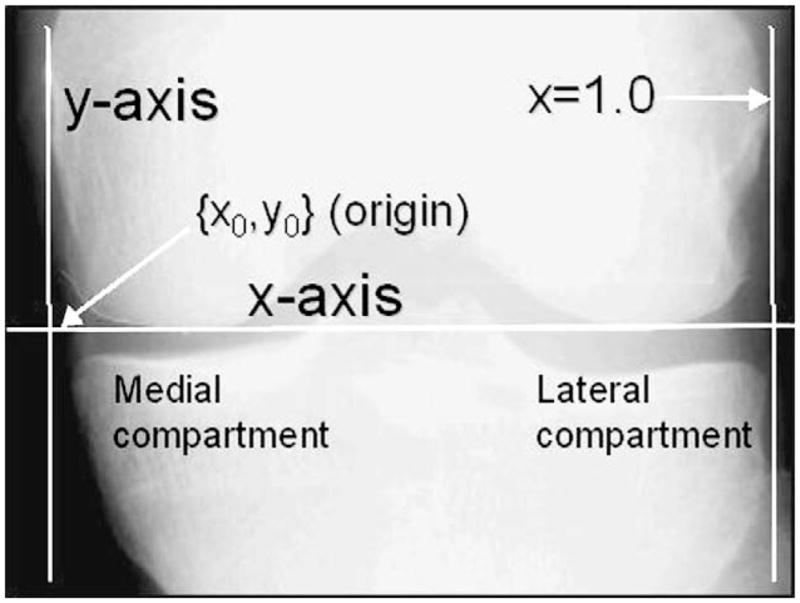
Objective: To establish the performance of location specific computer measures of radiographic joint space width (JSW) compared to measurements of minimum joint space width (mJSW) for the assessment of medial compartment knee osteoarthritis (OA). The study also investigated the most disease-responsive location for measuring medial compartment JSW.
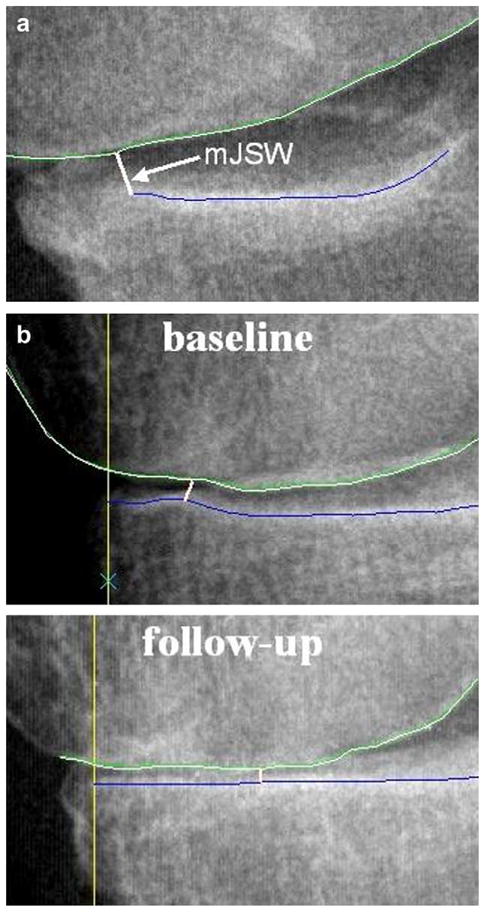
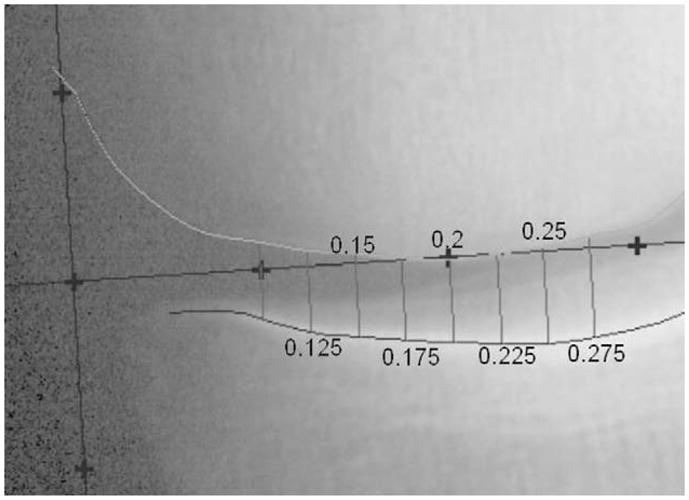
Methods: Serial bilateral Posterior Anterior (PA) conventional radiographs acquired with a fixed flexion protocol were obtained 36 months apart in 118 persons with knee OA participating in the Health, Aging and Body Composition (Health ABC) Study. Measurements of medial compartment mJSW and JSW at seven fixed locations were facilitated by the use of semi-automated software that delineated the femoral and tibial margins of the joint. A human reader operated custom software to verify and correct the software-drawn margins where necessary. Paired images were displayed with the reader blinded to the chronological order. The amount of joint space narrowing was measured and the standardized response mean (SRM) was used as a metric to quantify performance.
Results: For all subjects, the mJSW SRM value was 0.42 while, for the most responsive location specific measure of JSW, it was SRM=0.46. For subjects with a Kellgren-Lawrence (KL) score less than or equal to 1, mJSW (SRM=0.40) was more responsive than the new measures (Maximum SRM=0.30). For KL=2or3, SRM=0.49 for mJSW, and SRM=0.74 for the most responsive location specific measure of JSW. Improved responsiveness was observed in the more central portion of the joint on the more diseased knees.
Conclusions: Location specific computer measures of JSW are feasible and potentially provide a superior method to assess radiographic OA for more diseased subjects. This new measure has the potential to improve the power of clinical studies that use a fixed flexion protocol.
Conflict of interest statement
There are no conflicts of interest of any authors with the work presented in this manuscript.
Figures
References
-
- Schned ES, Reinertsen JL. The social and economic consequences of rheumatic disease. In: Klippel JH, editor. Primer on the Rheumatic Diseases. Atlanta: William M. Otto; 1997. pp. 6–9.
-
- Lawrence RC, Helmick CG, Arnett FC, Deyo RA, Felson DT, Giannini EH, et al. Estimates of the prevalence of arthritis and selected musculoskeletal disorders in the United States. Arthritis Rheum. 1998;41(5):778–99. - PubMed
-
- Michaud K, Messer J, Choi HK, Wolfe F. Direct medical costs and their predictors in patients with rheumatoid arthritis: a three-year study of 7,527 patients. Arthritis Rheum. 2003;48(10):2750–62. - PubMed
-
- Peterfy CG. Imaging of the disease process. Curr Opin Rheumatol. 2002;14(5):590–6. - PubMed
-
- Visser M, Newman AB, Nevitt MC, Kritchevsky SB, Stamm EB, Goodpaster BH, et al. Reexamining the sarcopenia hypothesis. Muscle mass versus muscle strength. Health, Aging, and Body Composition Study Research Group. Ann N Y Acad Sci. 2000;904:456–61. - PubMed
Publication types
MeSH terms
Grants and funding
LinkOut - more resources
Full Text Sources
