

Conflicts of interest and the evolution of decision sharing
- PMID: 19073479
- PMCID: PMC2689720
- DOI: 10.1098/rstb.2008.0257
Conflicts of interest and the evolution of decision sharing
Abstract
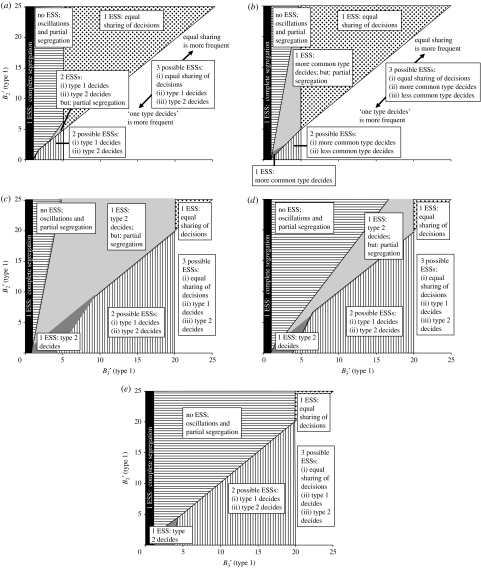
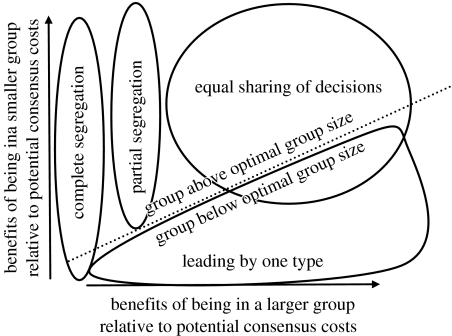
Social animals regularly face consensus decisions whereby they choose, collectively, between mutually exclusive actions. Such decisions often involve conflicts of interest between group members with respect to preferred action. Conflicts could, in principle, be resolved, either by sharing decisions between members ('shared decisions') or by one 'dominant' member making decisions on behalf of the whole group ('unshared decisions'). Both, shared and unshared decisions, have been observed. However, it is unclear as to what favours the evolution of either decision type. Here, after a brief literature review, we present a novel method, involving a combination of self-organizing system and game theory modelling, of investigating the evolution of shared and unshared decisions. We apply the method to decisions on movement direction. We find that both, shared and unshared, decisions can evolve without individuals having a global overview of the group's behaviour or any knowledge about other members' preferences or intentions. Selection favours unshared over shared decisions when conflicts are high relative to grouping benefits, and vice versa. These results differ from those of group decision models relating to activity timings. We attribute this to fundamental differences between collective decisions about modalities that are disjunct (here, space) or continuous (here, time) with respect to costs/benefits.
Figures
References
-
- Ame J.M., Halloy J., Rivault C., Detrain C., Deneubourg J.L. Collegial decision making based on social amplification leads to optimal group formation. Proc. Natl Acad. Sci. USA. 2006;103:5835–5840. doi:10.1073/pnas.0507877103 - DOI - PMC - PubMed
-
- Austen-Smith D., Feddersen T.J. Information aggregation and communication in committees. Phil. Trans. R. Soc. B. 2009;364:763–769. doi:10.1098/rstb.2008.0256 - DOI - PMC - PubMed
-
- Biro D., Sumpter D.J.T., Meade J., Guilford T. From compromise to leadership in pigeon homing. Curr. Biol. 2006;16:2123–2128. doi:10.1016/j.cub.2006.08.087 - DOI - PubMed
-
- Black J.M. Preflight signaling in swans—a mechanism for group cohesion and flock formation. Ethology. 1988;79:143–157.
-
- Boinski S., Campbell A.F. Use of trill vocalizations to coordinate troop movement among white-faced capuchins—a 2nd field-test. Behaviour. 1995;132:875–901. doi:10.1163/156853995X00054 - DOI
Publication types
MeSH terms
LinkOut - more resources
Full Text Sources