. 2009 Feb 13;284(7):4635-46.
doi: 10.1074/jbc.M807085200. Epub 2008 Dec 10.

Co-inhibition of Plasmodium falciparum S-adenosylmethionine decarboxylase/ornithine decarboxylase reveals perturbation-specific compensatory mechanisms by transcriptome, proteome, and metabolome analyses

Affiliations

Co-inhibition of Plasmodium falciparum S-adenosylmethionine decarboxylase/ornithine decarboxylase reveals perturbation-specific compensatory mechanisms by transcriptome, proteome, and metabolome analyses

Anna C van Brummelen et al. J Biol Chem. .

Abstract

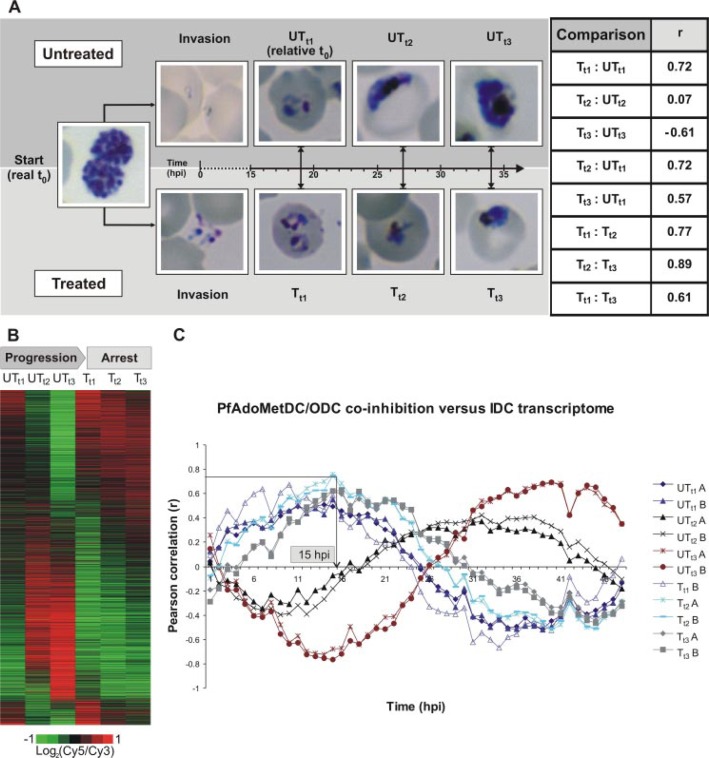
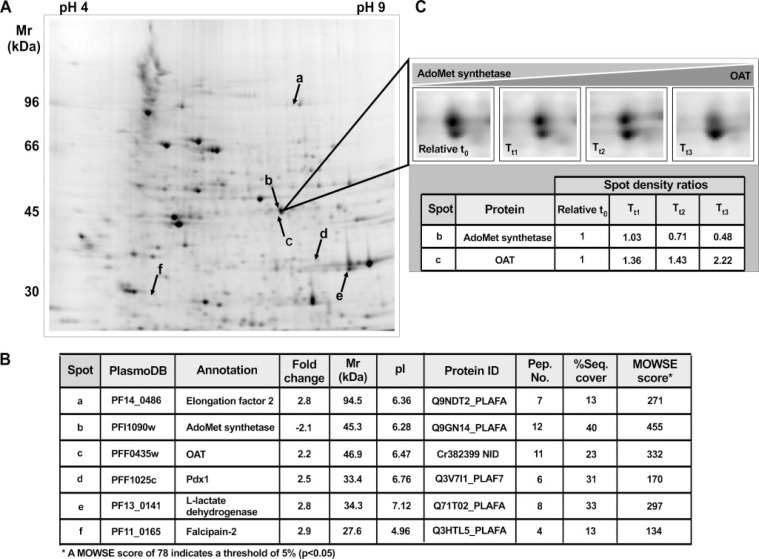
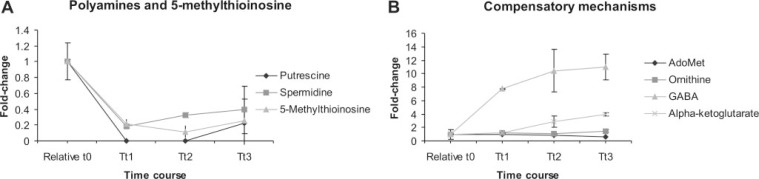
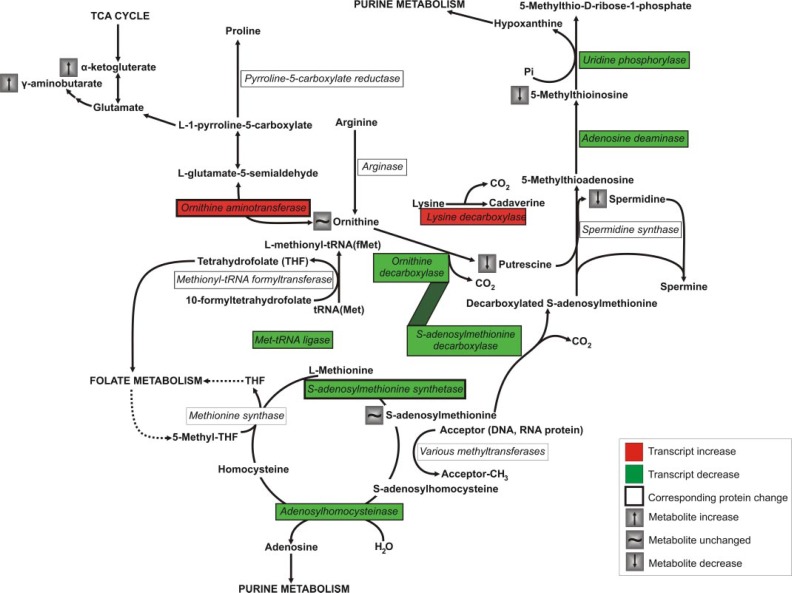
Polyamines are ubiquitous components of all living cells, and their depletion usually causes cytostasis, a strategy employed for treatment of West African trypanosomiasis. To evaluate polyamine depletion as an anti-malarial strategy, cytostasis caused by the co-inhibition of S-adenosylmethionine decarboxylase/ornithine decarboxylase in Plasmodium falciparum was studied with a comprehensive transcriptome, proteome, and metabolome investigation. Highly synchronized cultures were sampled just before and during cytostasis, and a novel zero time point definition was used to enable interpretation of results in lieu of the developmentally regulated control of gene expression in P. falciparum. Transcriptome analysis revealed the occurrence of a generalized transcriptional arrest just prior to the growth arrest due to polyamine depletion. However, the abundance of 538 transcripts was differentially affected and included three perturbation-specific compensatory transcriptional responses as follows: the increased abundance of the transcripts for lysine decarboxylase and ornithine aminotransferase and the decreased abundance of that for S-adenosylmethionine synthetase. Moreover, the latter two compensatory mechanisms were confirmed on both protein and metabolite levels confirming their biological relevance. In contrast with previous reports, the results provide evidence that P. falciparum responds to alleviate the detrimental effects of polyamine depletion via regulation of its transcriptome and subsequently the proteome and metabolome.


Figures

FIGURE 1.
FIGURE 1.
Transcriptional arrest prior to cytostasis. A, Giemsa-stained thin smears of treated (T) and untreated (UT) P. falciparum cultures. DFMO/MDL73811 treatment was initiated in the schizont stage at about 42 hpi (real t0) and sampled at t1 = 19 hpi, t2 = 27 hpi, and t3 = 34 hpi. Pearson correlation coefficients (r) of transcriptome data are tabled. The close correlations between UTt1 and Tt1 to Tt3 compared with the low correlation with the matched untreated controls at t2 and t3 is the result of transcriptional arrest at t1 (technical replicates correlated at 0.93 and biological replicates at 0.88 on average). However, growth arrest was morphologically observed only from t2 (Tt2 to Tt3). The transcriptional arrest negated direct comparison of parallel treated and untreated time points at t2 and t3, and UTt1 was defined as a relative t0 for quantitative differential abundance analysis. B, phaseogram depicting the transcriptional profiles over the three time points (t1 to t3) by ordering 3206 oligonucleotides according to the phase of expression. Transcriptional arrest is visible in Tt1 to Tt3. C, Pearson correlation between the PfAdoMetDC/ODC co-inhibition data and the 1-h time points of the 3D7 IDC transcriptome. All three treated samples have a correlation profile similar to UTt1 (relative t0), which corroborates the transcriptional arrest and also indicates the approximate time thereof as ∼15–16 hpi. Data of the respective biological replicates (A and B) are shown separately (Tt1 had only one biological replicate because of technical difficulty).
FIGURE 2.
FIGURE 2.
Two-dimensional gel electrophoresis illustrated with a typical gel image (UTt1_tech_repl_1) indicating the positions of a subset of proteins (A), the protein identities and characteristics (B), and an enlarged view of AdoMet synthetase and OAT (just below) over the time course, including the respective spot densities (C). Spot density ratios were calculated compared with UTt1 (relative t0) with p < 0.05. Protein ID = the MASCOT search identifier; Pep. No. = the number of peptides identified in the mass spectrum.
FIGURE 3.
FIGURE 3.
Selected metabolite profiles during cytostasis induced by PfAdoMetDC/ODC co-inhibition. A, putrescine, spermidine, and 5-methylthioinosine levels decreased as expected, but cadaverine and spermine were too low for reliable detection. B, AdoMet and ornithine levels did not accumulate despite PfAdoMetDC/ODC co-inhibition, but ornithine enters glutamate metabolism via OAT, and the glutamate metabolites, α-ketoglutarate and GABA, increased.
FIGURE 4.
FIGURE 4.
Polyamine and methionine metabolism (adapted from Malaria Parasite Metabolic Pathways). Plasmodial spermine synthesis is currently believed to be catalyzed by spermidine synthase as indicated (75). Enzymes of which the transcript abundance was significantly increased are indicated in red and those significantly decreased are indicated in green, whereas proteins with confirmed corresponding abundance are framed with a thick border. Metabolites that were unchanged or that were increased or decreased at least 2-fold are indicated.

Similar articles

Cited by

References

    1. Wallace H, Fraser A, Huges A. Biochem J. 2003;376:1–14. - PMC - PubMed
    1. Igarashi K, Kashiwagi K. Biochem Biophys Res Commun. 2000;271:559–564. - PubMed
    1. Tadolini B. Biochem J. 1988;249:33–36. - PMC - PubMed
    1. Muscari C, Guarnieri C, Giaccari A, Caldarera C. Mol Cell Biochem. 1995;144:125–129. - PubMed
    1. Seiler N, Raul F. J Cell Mol Med. 2005;9:623–642. - PMC - PubMed

Publication types

MeSH terms