. 2008 Dec 16;105(50):19857-62.
doi: 10.1073/pnas.0810713105. Epub 2008 Dec 10.

The defect in T-cell regulation in NOD mice is an effect on the T-cell effectors

Affiliations

The defect in T-cell regulation in NOD mice is an effect on the T-cell effectors

Anna Morena D'Alise et al. Proc Natl Acad Sci U S A. .

Abstract

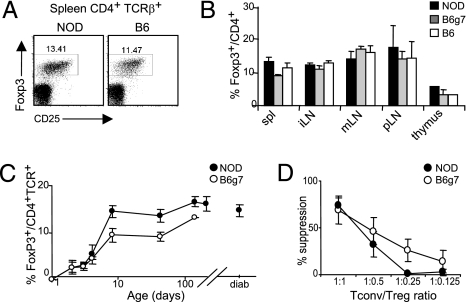
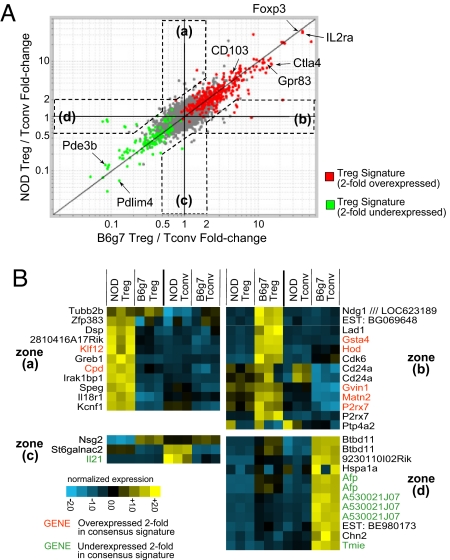
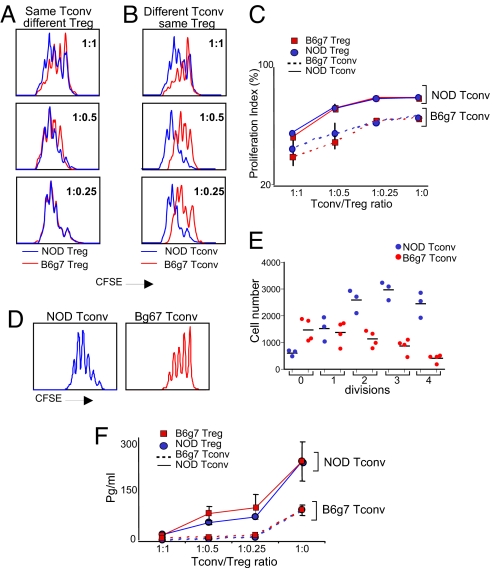
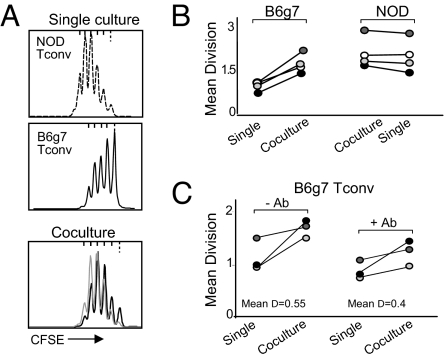
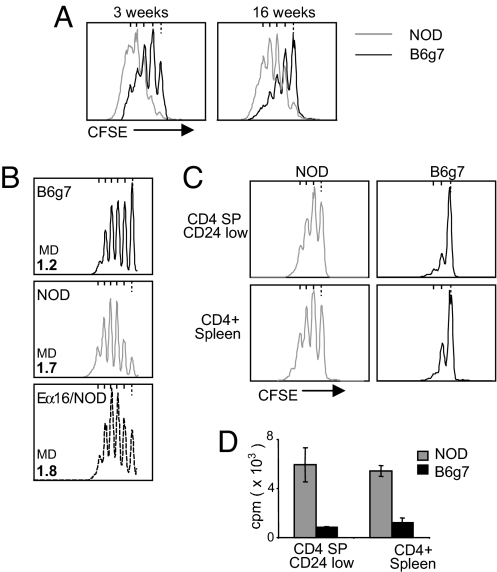
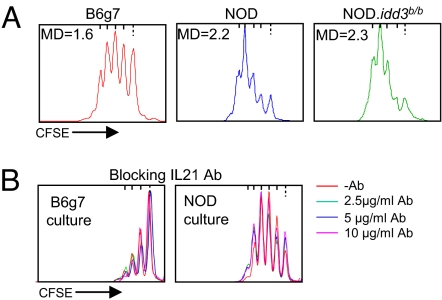
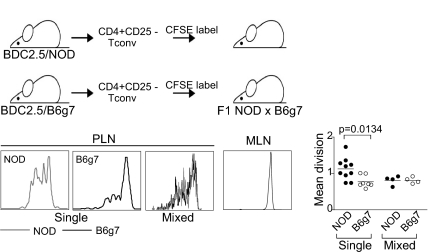
FoxP3(+) regulatory T cells (Tregs) protect against autoimmunity, type 1 diabetes (T1D) in particular, prompting the hypothesis that a deficiency in Tregs is a critical determinant of diabetes susceptibility in NOD mice. However, tests of this hypothesis have yielded contradictory results. We confirmed that NOD mice, compared with reference strains, do not have a primary deficit in Treg numbers in the lymphoid organs, whether in prediabetic mice of any age or in animals with recent-onset diabetes. NOD Tregs did show a defect in standard in vitro T cell suppression assays, particularly at low suppressor/effector ratios. Gene expression profiling revealed the vast majority of transcripts constituting the "Treg signature" to be normally distributed in NOD Tregs versus CD4(+) T conventional (Tconv) cells, although there were a few differences affecting one or the other population. According to results from criss-cross experiments, the functional inefficacy was not rooted in NOD Tregs, which suppressed as well as their C57BL/6 (B6) counterparts, but rather in NOD Tconv, which were less prone to suppression than were B6 Tconv cells. They also responded more effectively to anti-CD3/28 monoclonal antibody (mAb) stimulation in vitro or to a natural pancreatic antigen in vivo. This difference was independent of autoimmune inflammation, did not map to the idd3 region, and was not due to the overproduction of interleukin-21 in NOD mice. That the immune dysregulation in this T1D model is rooted in the ability of effector T cells to be regulated, rather than in Tregs themselves, has implications for proposed therapeutic interventions.


Conflict of interest statement

The authors declare no conflict of interest.

Figures

Fig. 1.
Fig. 1.
No deficit of Treg number in NOD mice. Cells from several lymphoid organs from NOD, B6, or B6g7 mice stained intracellularly for FoxP3. (A) Representative CD25/FoxP3 cytometry profiles of gated CD4+TCRβ+ cells (numbers are percentage of FoxP3+ among CD4+ cells). (B) Percent FoxP3+ among spleen (spl), inguinal (iLN), mesenteric (mLN), pancreatic (pLN) LNs, and thymus from 6-week-old mice (mean ± SD, n = 4). (C) Mean percent FoxP3+ among CD4+ spleen cells from NOD and B6g7 mice at different ages (n = 3–8 mice per group). (D) Suppressor activity of CD4+GFP+ Treg cells, sorted from Foxp3GFP reporter mice backcrossed onto the NOD or B6 backgrounds, and cocultured with background matched CD4+GFP indicator cells (mean ± SD from four independent experiments).
Fig. 2.
Fig. 2.
The Treg signature in NOD cells. Microarray comparison of gene expression in CD4+CD25+ Treg cells from 6-week-old NOD and B6g7 mice. (A) Comparison of Treg signatures (defined as ratio of expression in Treg relative to CD4+CD25 Tconv cells) between NOD and B6g7 splenocytes. Red and green highlights correspond to a previously defined consensus signature (twofold over- or underexpressed in Treg relative to Tconv) (29). Transcripts differentially expressed in one strain but not the other are identified by zones a-d. (B) Normalized expression values of transcripts falling in the zones a-d are defined in (A) (log2 scale).
Fig. 3.
Fig. 3.
Tregs from NOD and B6g7 mice are equally effective but NOD Tconv are hyperresponsive. (A) Splenic CD4+CD25+ Treg and CD4+CD25 Tconv cells from young NOD and B6g7 mice were titrated in criss-cross combinations in anti-CD3-stimulated cultures, and proliferation measured as dilution of the CFSE label. Representative titrations are shown in (A) (comparing Treg from NOD and B6g7 against the same CFSE-labeled NOD Tconv) and (B) (same Treg from NOD titrated against CFSE-labeled NOD or B6g7 Tconv). (C) Compilation of results from three independent experiments (proliferation index shown is the percentage of divided cells). (D) Comparative CFSE dilution of labeled NOD or B6g7 CD4+CD25 cells activated in vitro with antiCD3/CD28 (representative histograms from >10 experiments). (E) Distribution of absolute cell numbers in each division peak for activated NOD and B6g7 Tconv cells, in experiments similar to that shown in (D). (F) IL-2 levels were measured in the supernatant of Treg-Tconv cocultures shown in (A) (representative of three experiments).
Fig. 4.
Fig. 4.
The higher responsiveness of NOD Tconv cells is dominant in coculture experiments. (A) CFSE-labeled NOD and B6g7 Tconv were activated with antiCD3/CD28 independently or in cocultures, and their proliferation measured by CFSE dilution (cells were distinguished after mixed cultures on the basis of CD45 allotype markers). (B) A compilation of mean division numbers (calculated by a weighted averaging of the number of cells in each division peak) in coculture experiments as shown in (A). (C) Co-cultures were performed in the absence or presence of blocking anti-IL-2 antibody.
Fig. 5.
Fig. 5.
The higher responsiveness of NOD Tconv cells is not dependent on autoimmune status. (A) Comparison of Tconv proliferation in anti-CD3/CD28 activated NOD and B6g7 splenocytes, at an age at which NOD mice have no autoimmune infiltration (3 weeks) or are in an advanced prediabetic state (16 weeks). (B) Proliferation of activated Tconv cells from B6g7, NOD, or NOD.Eα16 transgenic mice (profiles representative of three experiments, MD = mean division number). (C, D) Proliferation of anti-CD3/CD28 activated thymic CD4+CD8CD24low cells measured by CFSE dilution (C) or 3H-thymidine incorporation (D), each representative of three experiments.
Fig. 6.
Fig. 6.
The higher responsiveness of NOD Tconv cells does not map to Idd3 or involve IL-21. (A) Proliferation profile of CFSE-labeled anti-CD3/CD28-activated Tconv splenocytes from NOD, B6g7, NOD.idd3b/b mice (MD = mean division number, representative of three experiments). (B) Proliferation of NOD and B6g7 Tconv splenocytes activated with anti-CD3/CD28 in the presence of anti-IL-21-blocking antibody.
Fig. 7.
Fig. 7.
The higher responsiveness of NOD Tconv cells is also manifest with natural autoantigen in vivo. Naïve T cells from BDC2.5/NOD or BDC2.5/B6g7 mice were labeled with CFSE, and injected into (NODxB6)F1 hosts. Proliferation in response to the pancreatic autoantigen was detected in the PLN, but not in the irrelevant MLN. The mean division index observed in individual mice in three independent experiments is tabulated.

References

    1. Anderson MS, Bluestone JA. The NOD mouse: A model of immune dysregulation. Annu Rev Immunol. 2005;23:447–485. - PubMed
    1. Hong S, et al. The natural killer T-cell ligand alpha-galactosylceramide prevents autoimmune diabetes in non-obese diabetic mice. Nat Med. 2001;7:1052–1056. - PubMed
    1. Holler PD, et al. The same genomic region conditions clonal deletion and clonal deviation to the CD8{alpha}{alpha} and regulatory T cell lineages in NOD versus C57BL/6 mice. Proc Natl Acad Sci USA. 2007;104:7187–7192. - PMC - PubMed
    1. Sakaguchi S. Naturally arising CD4+ regulatory T cells for immunologic self-tolerance and negative control of immune responses. Annu Rev Immunol. 2004;22:531–562. - PubMed
    1. Fontenot JD, Rudensky AY. A well adapted regulatory contrivance: Regulatory T cell development and the forkhead family transcription factor Foxp3. Nat Immunol. 2005;6:331–337. - PubMed

Publication types

MeSH terms

Substances

Associated data