

Inhibition of Mammalian target of rapamycin by rapamycin causes the regression of carcinogen-induced skin tumor lesions
- PMID: 19073969
- PMCID: PMC3407681
- DOI: 10.1158/1078-0432.CCR-08-0703
Inhibition of Mammalian target of rapamycin by rapamycin causes the regression of carcinogen-induced skin tumor lesions
Abstract
Purpose: The activation of Akt/mammalian target of rapamycin (mTOR) pathway represents a frequent event in squamous cell carcinoma (SCC) progression, thus raising the possibility of using specific mTOR inhibitors for the treatment of SCC patients. In this regard, blockade of mTOR with rapamycin prevents the growth of human head and neck SCC cells when xenotransplanted into immunodeficient mice. However, therapeutic responses in xenograft tumors are not always predictive of clinical anticancer activity.
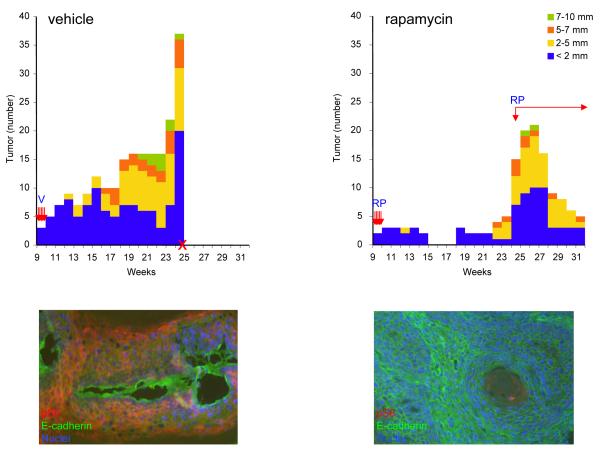
Experimental design: As genetically defined and chemically induced animal cancer models often reflect better the complexity of the clinical setting, we used here a two-step chemical carcinogenesis model to explore the effectiveness of rapamycin for the treatment of skin SCC.
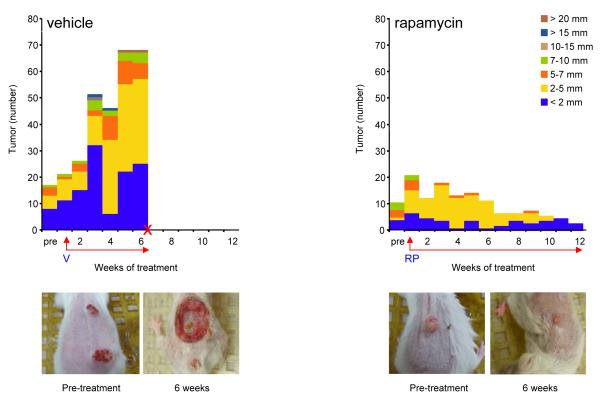
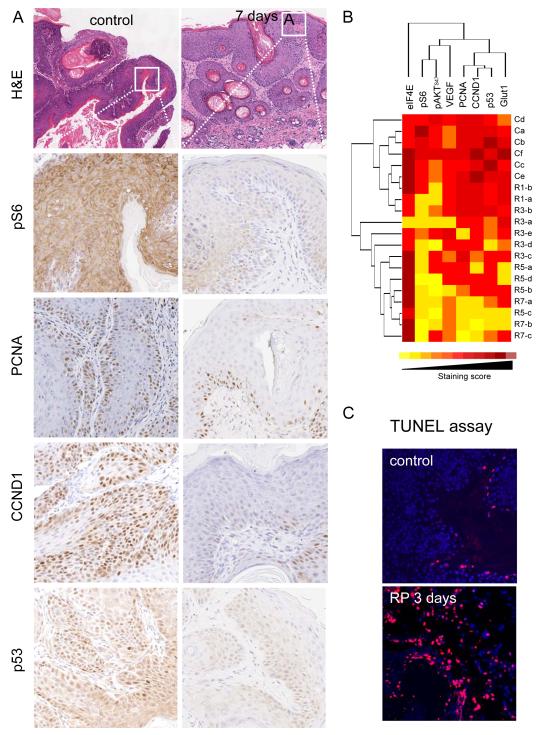
Results: Rapamycin exerted a remarkable anticancer activity in this chemically induced cancer model, decreasing the tumor burden of mice harboring early and advanced tumor lesions, and even recurrent skin SCCs. Immunohistochemical studies on tumor biopsies and clustering analysis revealed that rapamycin causes the rapid decrease in the phosphorylation status of mTOR targets followed by the apoptotic death of cancer cells and the reduction in the growth and metabolic activity of the surviving ones, concomitant with a decrease in the population of cancer cells expressing mutant p53. This approach enabled investigating the relationship among molecular changes caused by mTOR inhibition, thus helping identify relevant biomarkers for monitoring the effectiveness of mTOR inhibition in the clinical setting.
Conclusions: Together, these findings provide a strong rationale for the early evaluation of mTOR inhibitors as a molecular targeted approach to treat SCC.
Figures
References
-
- Vogelstein B, Kinzler KW. Cancer genes and the pathways they control. Nat Med. 2004;10:789–99. - PubMed
-
- Forastiere A, Koch W, Trotti A, Sidransky D. Head and neck cancer. N Engl J Med. 2001;345:1890–900. - PubMed
-
- Patel V, Rosenfeldt HM, Lyons R, et al. Persistent activation of Rac1 in squamous carcinomas of the head and neck: evidence for an EGFR/Vav2 signaling axis involved in cell invasion. Carcinogenesis. 2007;28:1145–52. - PubMed
-
- Pomerantz RG, Grandis JR. The role of epidermal growth factor receptor in head and neck squamous cell carcinoma. Curr Oncol Rep. 2003;5:140–6. - PubMed
-
- Dorsam RT, Gutkind JS. G-protein-coupled receptors and cancer. Nat Rev Cancer. 2007;7:79–94. - PubMed
MeSH terms
Substances
Grants and funding
LinkOut - more resources
Full Text Sources
Medical
Research Materials
Miscellaneous
