. 2008 Dec 10;28(50):13435-47.
doi: 10.1523/JNEUROSCI.3235-08.2008.

RIM1alpha and RIM1beta are synthesized from distinct promoters of the RIM1 gene to mediate differential but overlapping synaptic functions

Affiliations

RIM1alpha and RIM1beta are synthesized from distinct promoters of the RIM1 gene to mediate differential but overlapping synaptic functions

Pascal S Kaeser et al. J Neurosci. .

Abstract

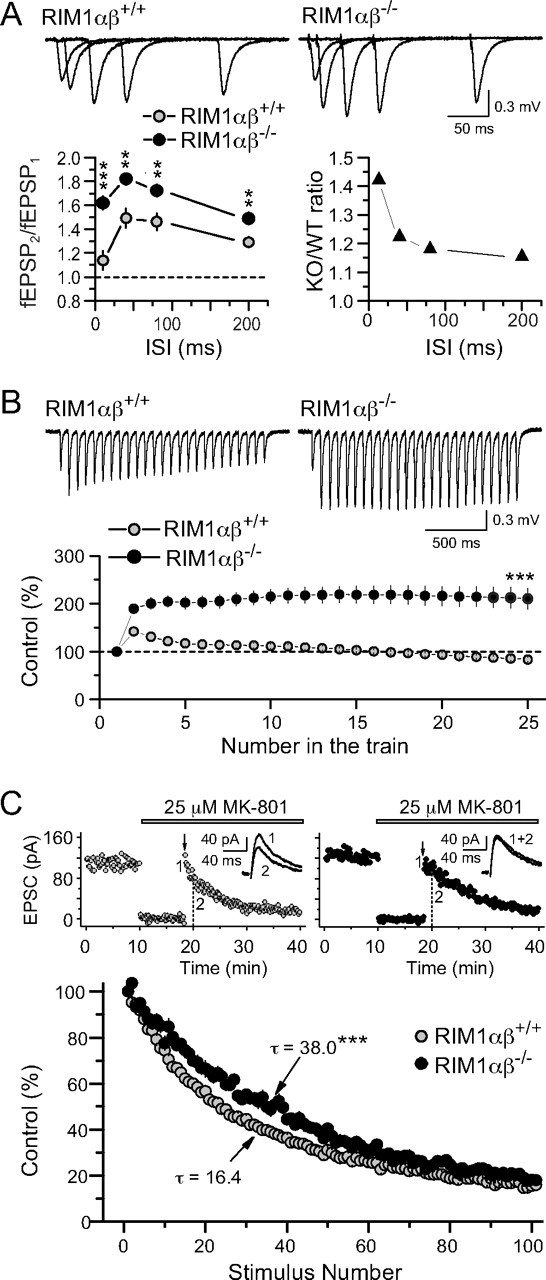
At a synapse, presynaptic terminals form a specialized area of the plasma membrane called the active zone that mediates neurotransmitter release. RIM1alpha is a multidomain protein that constitutes a central component of the active zone by binding to other active zone proteins such as Munc13 s, alpha-liprins, and ELKS, and to synaptic vesicle proteins such as Rab3 and synaptotagmin-1. In mice, knockout of RIM1alpha significantly impairs synaptic vesicle priming and presynaptic long-term plasticity, but is not lethal. We now find that the RIM1 gene encodes a second, previously unknown RIM1 isoform called RIM1beta that is upregulated in RIM1alpha knock-out mice. RIM1beta is identical to RIM1alpha except for the N terminus where RIM1beta lacks the N-terminal Rab3-binding sequence of RIM1alpha. Using newly generated knock-out mice lacking both RIM1alpha and RIM1beta, we demonstrate that different from the deletion of only RIM1alpha, deletion of both RIM1alpha and RIM1beta severely impairs mouse survival. Electrophysiological analyses show that the RIM1alphabeta deletion abolishes long-term presynaptic plasticity, as does RIM1alpha deletion alone. In contrast, the impairment in synaptic strength and short-term synaptic plasticity that is caused by the RIM1alpha deletion is aggravated by the deletion of both RIM1alpha and RIM1beta. Thus, our data indicate that the RIM1 gene encodes two different isoforms that perform overlapping but distinct functions in neurotransmitter release.


Figures

Figure 1.
Figure 1.
RIM1β is a new RIM1 isoform that is expressed throughout the brain. A, Distribution of RIM1α and RIM1β in brain area homogenates of wild-type and littermate RIM1α KO mice at postnatal day 17. RIM1α and β were detected with antibodies against (from top to bottom) the RIM1α N terminus (polyclonal), the RIM1 PDZ domain (monoclonal) and the RIM1 central region (containing the PDZ domain and flanking regions, polyclonal). VCP was used as a loading control, protein size in kilo Dalton (kD) is indicated on the right. The following brain areas were used: OB, olfactory bulb; VS, ventral striatum; DS, dorsal striatum; HIP, hippocampus; CX, frontal cortex; CB, cerebellum; BS, brainstem; SC, spinal cord. B, Regional and developmental expression profile of RIM1α and RIM1β in wild-type mice at postnatal days 1, 5, 10, 15, 20 and 50. RIM1α and β expression were assessed with the polyclonal antiserum against the RIM1 central region, and GDI was used as a loading control. *Cross-reactive band of unknown origin. C, Quantitative immunoblotting with 125iodine coupled secondary antibodies in 3 17-d-old RIM1α wild-type and KO littermate pairs with the monoclonal RIM1 PDZ domain antibody (top) and the polyclonal antiserum against the central domain (bottom). VCP antiserum was used as a loading control. D, Quantitative analysis of RIM1α and RIM1β expression based on the Western blots shown in C. RIM1α and β were normalized to the level of VCP. *p < 0.05, **p < 0.005.
Figure 2.
Figure 2.
Generation and basic characterization of conditional RIM1αβ KO mice. A, Map of the mouse RIM1 gene (aka Rims1), alternative 5′ exons are marked with 1′ (for 1α) and 1″ (for 1β), respectively. The gene targeting experiments for RIM1α (red) and RIM1αβ (blue) are indicated. The gene is located in area 1A3 of chromosome 1. B, Schematic representation of RIM1α and RIM1β, note that RIM1β lacks the helix α-1 at the N terminus (Zn, zinc finger domain; S, serine 413 residue; PxxP, proline rich region). Protein interactions with the active zone (bottom) or other presynaptic proteins (top) are indicated. The area and isoforms that were targeted in the RIM1α (red) and the RIM1αβ KO (blue) mice are indicated with bars and shaded backgrounds. C, Targeting strategy for exon 6 of the RIM1 gene, showing (from top to bottom) the wild-type allele, the targeting construct, the original mutant allele, the flp-recombined floxed allele and the cre recombined KO allele (DT, diphtheria toxin cassette; N, neomycin resistance cassette; * serine 413 to alanine point mutation that was repaired in the embryonic stem cells; 5–7, exons 5–7). D, Immunoblotting of brain homogenates from RIM1αβfloxed, RIM1αβ KO, RIM1α KO and wild-type littermate control mice (all at postnatal day 17) with an antibody against the RIM1 N terminus domain [top, *, crossreactivity with rabphilin (Schoch et al., 2002)] and the RIM1 central domain (bottom), protein size (kD) is indicated on the left. VCP was used as an internal control. E, RT-PCR on mRNA purified from the frontal cortex of RIM1αβ KO mice, RIM1α KO mice and wild-type littermate control mice (all postnatal day 17), oligonucleotide primers for neuroligin 2/4* were used as a positive control, the 100 bp DNA ladder is indicated.
Figure 3.
Figure 3.
Survival is affected in RIM1αβ KO mice. A, Survival rate in offsprings of heterozygous matings in the floxed and the KO line. p values were measured by χ test comparing the observed distribution with the expected Mendelian distribution (shaded background with dotted line; n.s., not significant, RIM1αβ KO, p < 6.7 × 10⁻¹⁸). B, Survival rate in offsprings of heterozygous matings in the RIM1α KO and in the RIM1αβ KO mice after the genetic background of the two lines has been mixed for two generations (RIM1α KO not significant, RIM1αβ KO p < 1.8 × 10⁻⁴).
Figure 4.
Figure 4.
Protein quantitation in particulate (P2) and soluble (S2) fractions of RIM1αβ KO mice. A, Schematic demonstration of the method used to generate the S2 and P2 fractions, arrows indicate centrifugation at the specified g-force and time. B, Immunoblotting of P2 and S2 fractions with 125iodine labeled secondary antibodies for multiple active zone and other proteins in brains from RIM1αβ KO mice and wild-type littermate controls (n = 3 for each fraction and genotype, all at 8–9 weeks of age, * marks SNAP-25, this antibody was added at the same time, but not used for quantitation). β-Actin is shown as a loading control. C, D, Quantitative analysis of protein contents in P2 (C) or S2 (D) normalized to VCP, GDI or β-actin. E, Percentage of solubility expressed as S2*100/(P2+S2), solubility is not indicated when <3% of the total amount of protein were soluble (statistical significance in C–E: *p < 0.05, **p < 0.01, ***p < 0.005). A more extensive list of proteins quantified can be found in supplemental Figure 5, available at www.jneurosci.org as supplemental material.
Figure 5.
Figure 5.
Short-term synaptic plasticity at excitatory Schaffer collateral to CA1 pyramidal cell synapses. A, Paired-pulse facilitation (fEPSP2/fEPSP1) measured at 10, 40, 80, and 200 ms ISI in wild-type and RIM1αβ KO animals. Bottom graphs show summary data (left) and ratio of the paired-pulse facilitation values between KO to wild-type mice (right). Sample traces (superimposed after subtraction of the first response) are shown above. Statistical significance: **p < 0.005, ***p < 0.0005. B, Synaptic responses evoked by a burst of 25 stimuli at 14 Hz in wild-type and RIM1αβ KO mice (responses were normalized to the first fEPSP in the train). Representative responses are shown above. Statistical significance (sample values are given in supplemental Table 4, available at www.jneurosci.org as supplemental material): ***p < 0.0001. C, Release probability in RIM1αβ KO mice and wild-type littermate controls as assessed by MK-801 block of NMDAR-EPSCs at 0.1 Hz stimulation. Representative single experiments are shown on top, afferent stimulation is stopped for 8 min during wash-in of MK-801, arrow marks the time when stimulation is resumed. Insets, NMDAR-EPSCs averaged from responses evoked by stimuli #1–3 and #11–13 at times indicated. For the summary time course of MK-801 block (bottom), the rate was fitted by second-order exponential decay, with the first time constant τ (in stimulus #) provided in the graph. Statistical significance for τ (RIM1αβ wild-type vs RIM1αβ KO): ***p < 0.0001.
Figure 6.
Figure 6.
Miniature and evoked inhibitory synaptic transmission in the CA1 region of RIM1α KO and RIM1αβ KO mice. A, B, mIPSC frequencies and amplitudes monitored in CA1 pyramidal cells of RIM1α KO mice (A) and RIM1αβ KO mice (B) compared with wild-type littermate controls. Representative mIPSC traces are shown on top. Statistical significance: *p < 0.05, **p < 0.005. C, D, Evoked IPSC amplitudes plotted as a function of stimulation intensity. Representative traces from each stimulus intensity (3, 6, 10, 15, 25, 40, and 70 V) are shown, each trace is the average of 3–5 responses. Sample values for statistical significance: (C) 6 V: p < 0.01; 25 V: p < 0.0001; 70 V: p < 0.00001; (D) 6 V: p < 0.005; 25 V and 70 V: p < 0.00001.
Figure 7.
Figure 7.
Short-term synaptic plasticity in inhibitory synapses in the CA1 region of RIM1α KO and RIM1αβ KO mice. A, B, Paired-pulse ratio (IPSC2/IPSC1) of evoked IPSCs measured at 20, 50, 200, and 400 ms ISI in RIM1α KO (A) and RIM1αβ KO mice (B). Statistical significance in A and B: *p < 0.05, **p < 0.005. Representative traces at each ISI (superimposed after subtraction of the first response) are shown above. C, D, KO to wild-type ratios are shown for both mouse lines.
Figure 8.
Figure 8.
Synaptic transmission in cultured hippocampal neurons lacking RIM1α or RIM1α and RIM1β deficient neurons. A, Evoked single inhibitory responses in cultured neurons at DIV 13–16 derived from newborn RIM1α KO mice and heterozygous control mice, IPSC charge and amplitude were quantified. B, The same experiment was performed in cultured neurons from newborn RIM1αβfloxed mice, and cultures were infected with lentivirus expressing cre recombinase (RIM1αβf/f:cre) or a recombination deficient deletion mutant of cre (RIM1αβf/f:control). C, D, Paired pulse experiments in cultures that lack RIM1α (C) or RIM1αβ (D) and corresponding control cultures. Sample traces are given on top. E, F, KO to control ratios of the paired pulse experiments for both lines. Statistical significance in A–D: *p < 0.05, **p < 0.005, ***p < 0.0005.
Figure 9.
Figure 9.
Presynaptic forms of long-term plasticity in the hippocampus of RIM1αβ KO mice. A, Time course of mossy fiber fEPSP amplitude in CA3. LTP was triggered by a burst of 125 stimuli at 25 Hz (arrow). Top inset, Sample traces from representative experiments obtained at the time points indicated. Each trace is the average of 5 min of recording. Statistical significance before versus after induction: RIM1αβ wild-type, p < 0.00001; RIM1αβ KO, p > 0.05. B, Time course of IPSC amplitude in whole-cell recordings in CA1. I-LTD was triggered by theta-burst stimulation (arrow). Top, Sample traces from representative experiments obtained at the time points indicated. Each trace is the average of 10 min of recording. Statistical significance before versus after induction: RIM1αβ wild-type, p < 0.001; RIM1αβ KO, p > 0.5.
Figure 10.
Figure 10.
RIM isoforms and RIM1-centered functional model of regulation of presynaptic neurotransmitter release. A, Overview of RIM isoforms of the 4 mammalian RIM genes. B, RIM1α and RIM1β regulate presynaptic plasticity distinctively. RIM1α and RIM1β mediate short-term plasticity and synaptic strength through Munc13 and other proteins. In addition, RIM1α is required for normal long-term plasticity through its interaction with Rab3. RIM1β does not participate in long-term plasticity, consistent with the absence of the Rab3 binding α-helix. Our data support a mechanism where these parameters are regulated through distinct coupling of RIM1α and RIM1β to Rab3 and/or Munc13.

Similar articles

Cited by

References

    1. Andrews-Zwilling YS, Kawabe H, Reim K, Varoqueaux F, Brose N. Binding to Rab3A-interacting molecule RIM regulates the presynaptic recruitment of Munc13-1 and ubMunc13–2. J Biol Chem. 2006;281:19720–19731. - PubMed
    1. Betz A, Thakur P, Junge HJ, Ashery U, Rhee JS, Scheuss V, Rosenmund C, Rettig J, Brose N. Functional interaction of the active zone proteins Munc13-1 and RIM1 in synaptic vesicle priming. Neuron. 2001;30:183–196. - PubMed
    1. Calakos N, Schoch S, Südhof TC, Malenka RC. Multiple roles for the active zone protein RIM1alpha in late stages of neurotransmitter release. Neuron. 2004;42:889–896. - PubMed
    1. Castillo PE, Janz R, Südhof TC, Tzounopoulos T, Malenka RC, Nicoll RA. Rab3A is essential for mossy fibre long-term potentiation in the hippocampus. Nature. 1997;388:590–593. - PubMed
    1. Castillo PE, Schoch S, Schmitz F, Südhof TC, Malenka RC. RIM1alpha is required for presynaptic long-term potentiation. Nature. 2002;415:327–330. - PubMed

Publication types

MeSH terms

LinkOut - more resources