. 2008 Dec 10;28(50):13488-504.
doi: 10.1523/JNEUROSCI.3536-08.2008.

Potential network mechanisms mediating electroencephalographic beta rhythm changes during propofol-induced paradoxical excitation

Affiliations

Potential network mechanisms mediating electroencephalographic beta rhythm changes during propofol-induced paradoxical excitation

Michelle M McCarthy et al. J Neurosci. .

Abstract

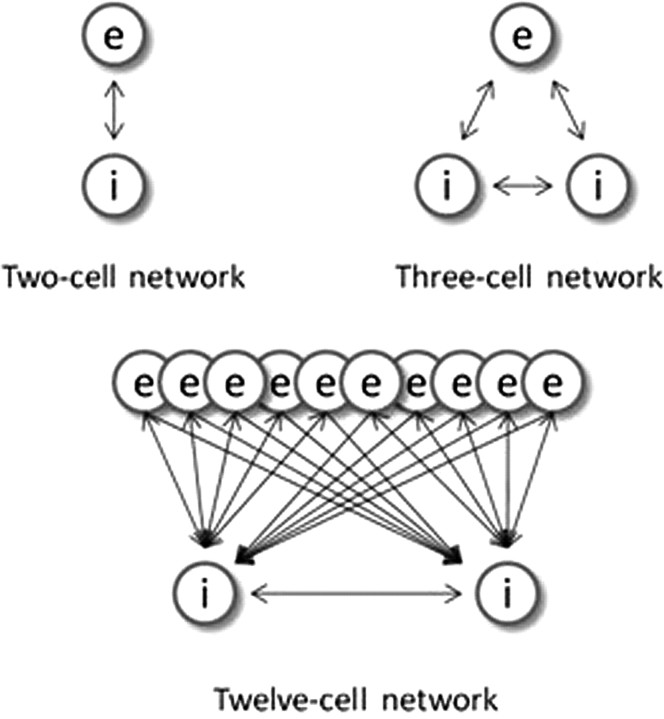
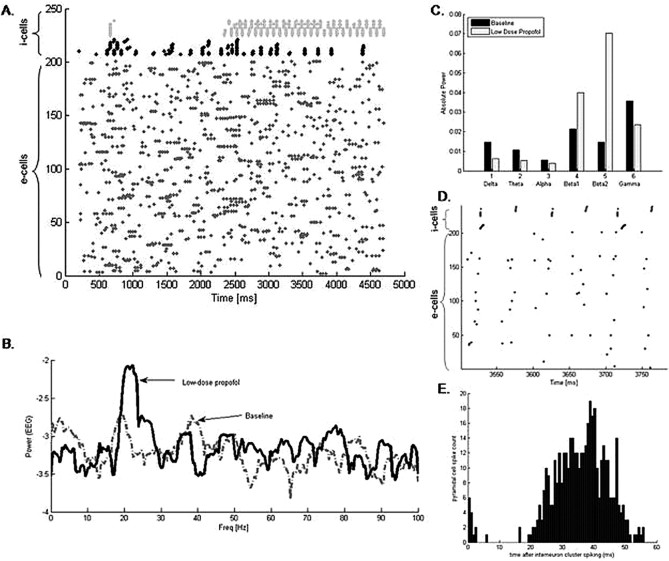
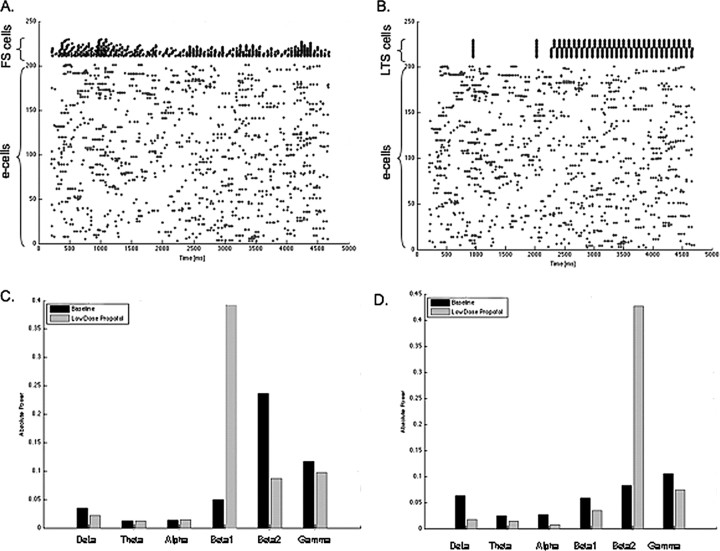
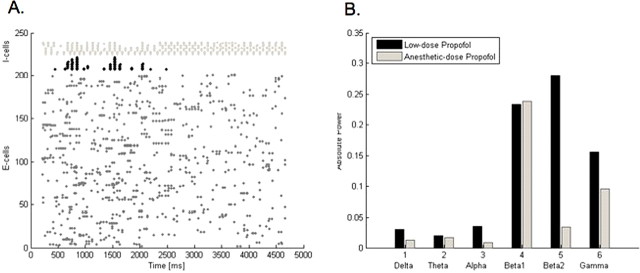
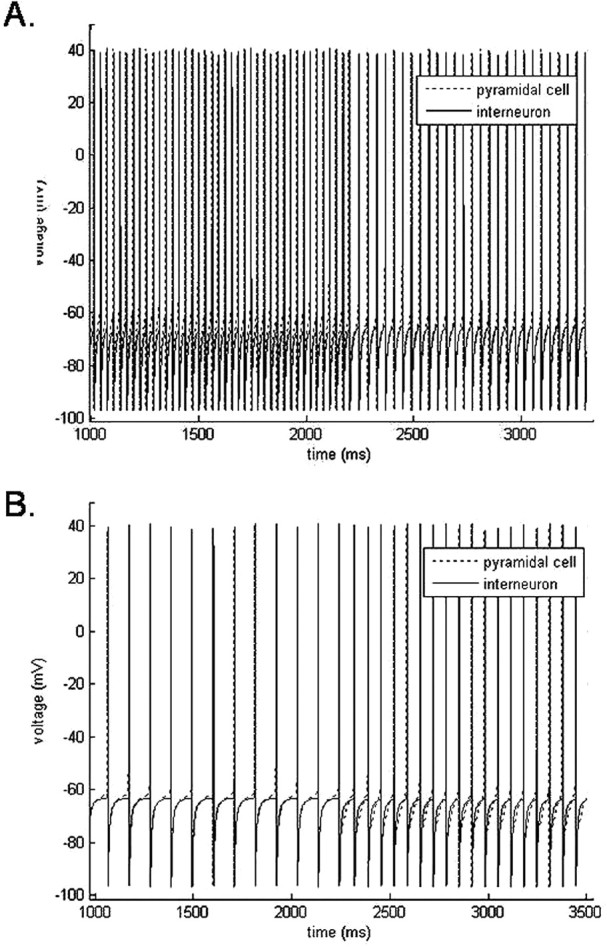
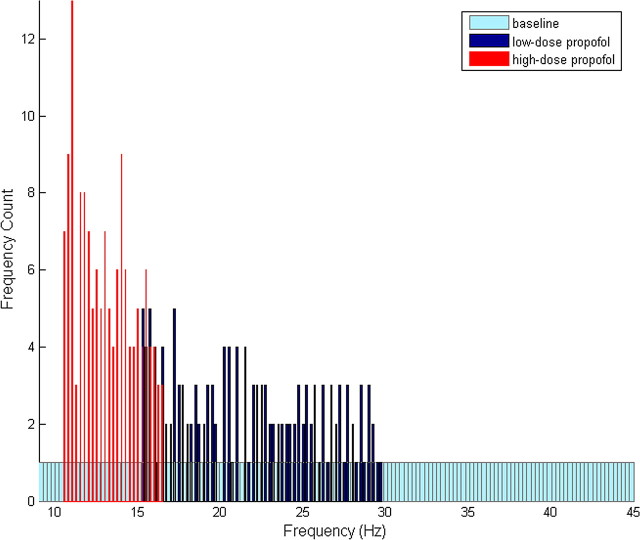
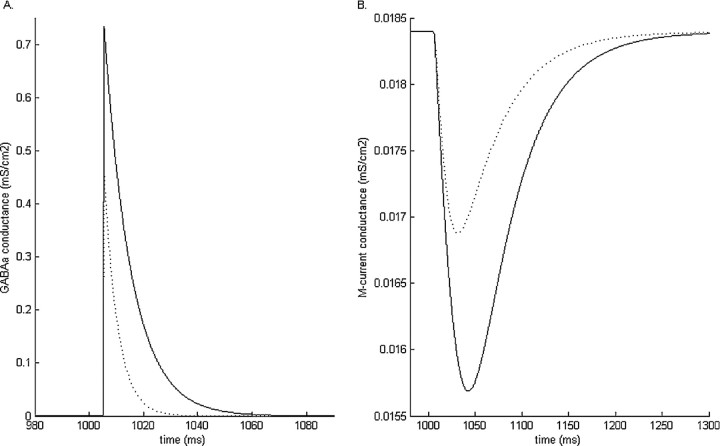
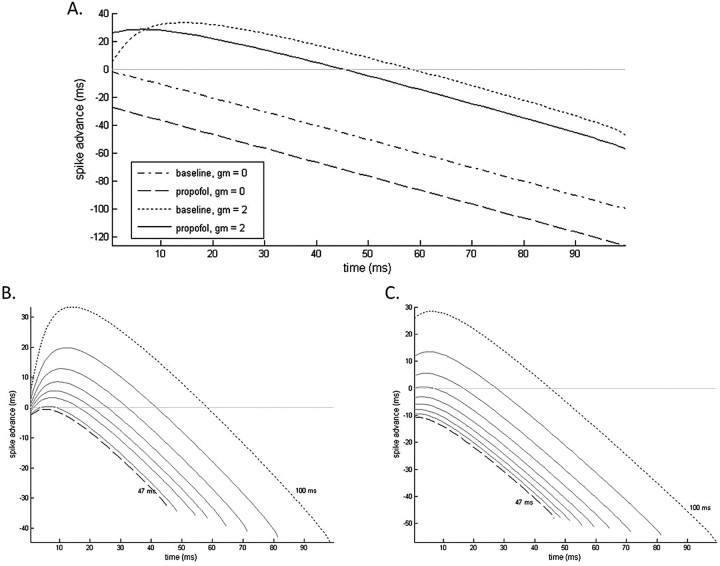
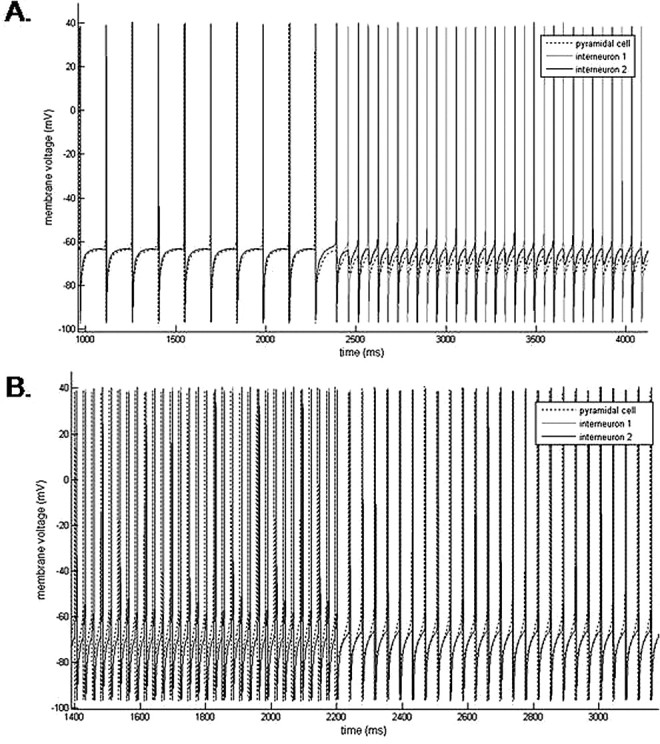
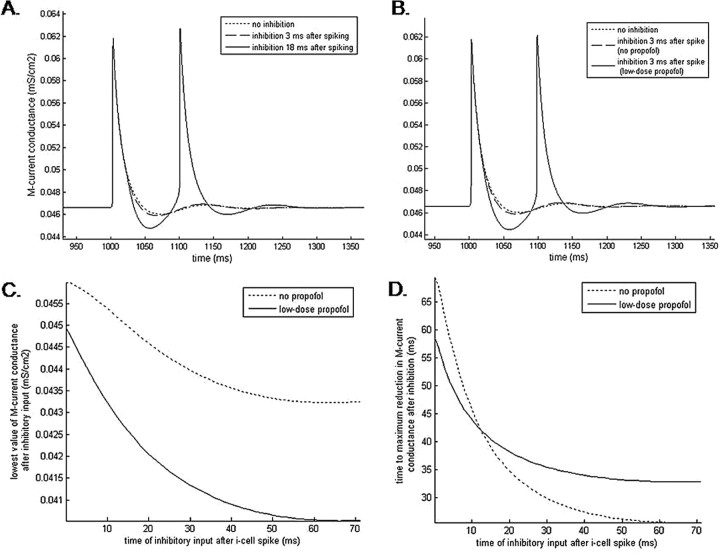
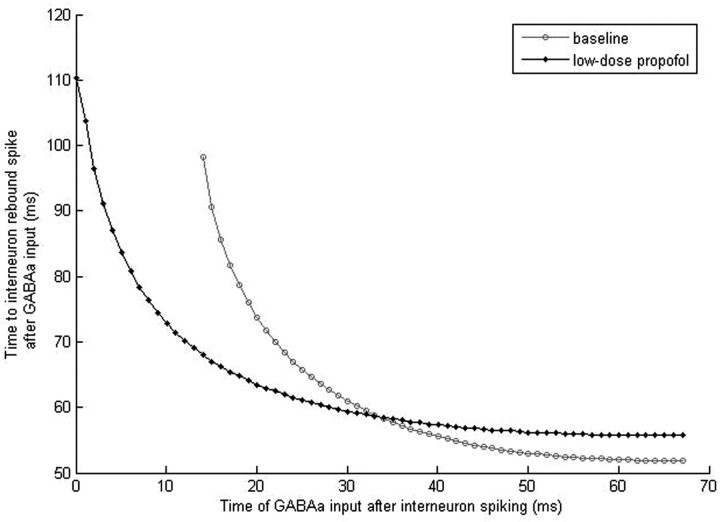
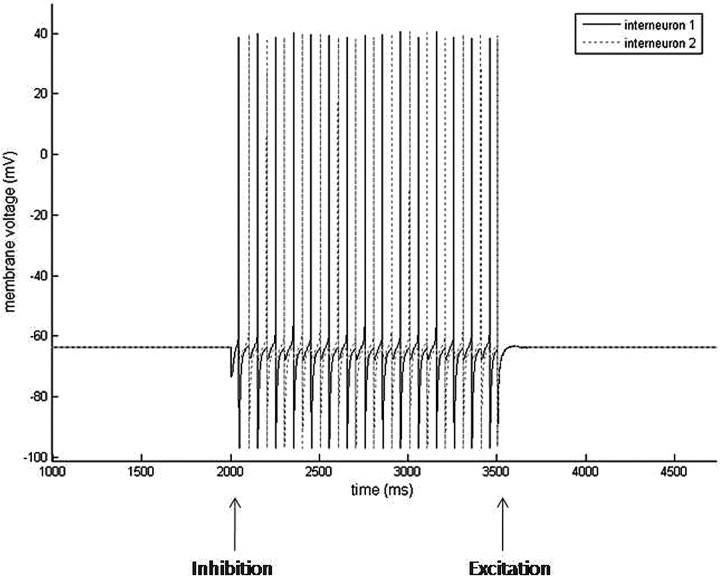
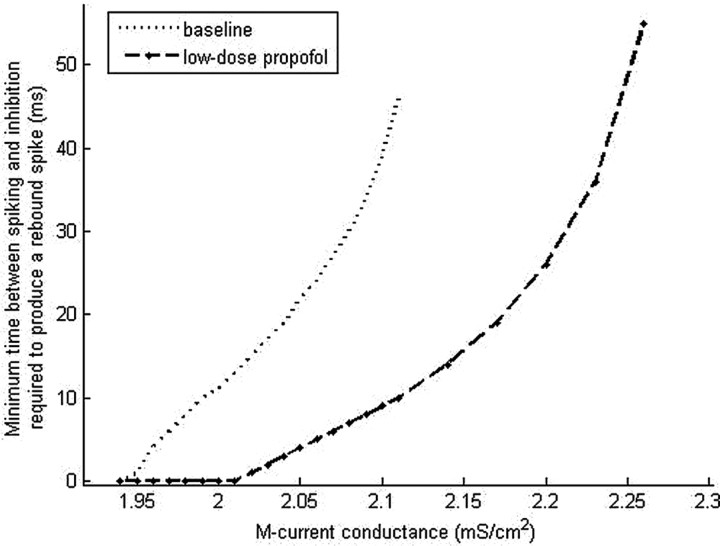
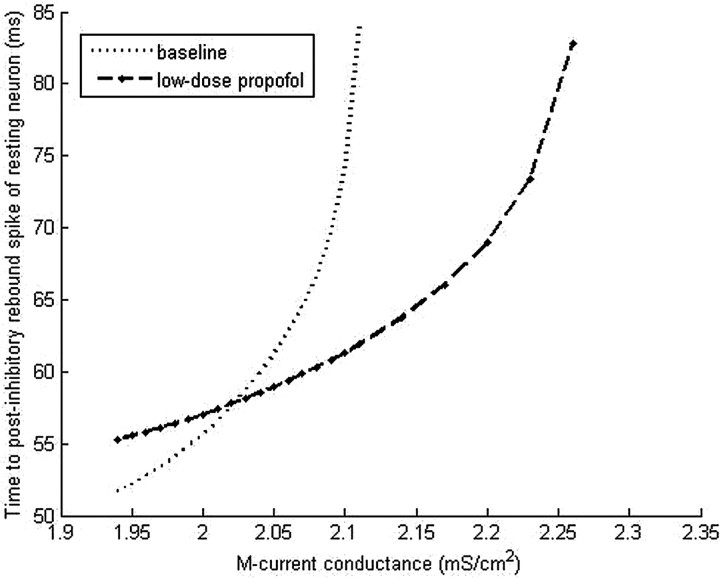
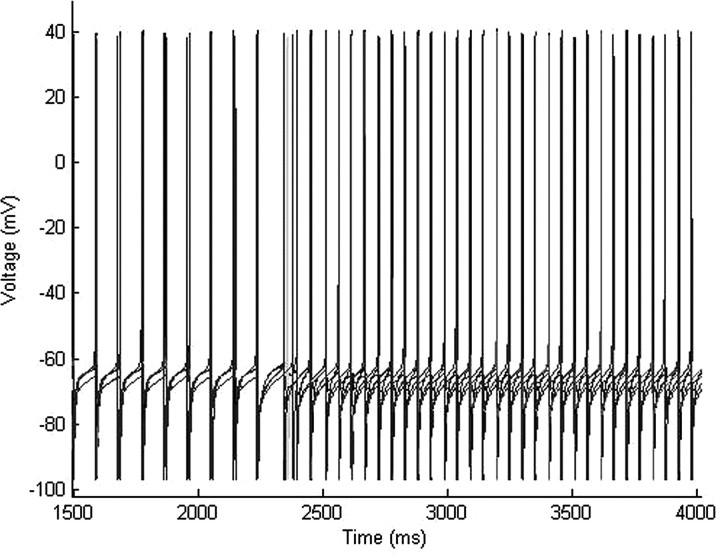
Propofol, like most general anesthetic drugs, can induce both behavioral and electroencephalographic (EEG) manifestations of excitation, rather than sedation, at low doses. Neuronal excitation is unexpected in the presence of this GABA(A)-potentiating drug. We construct a series of network models to understand this paradox. Individual neurons have ion channel conductances with Hodgkin-Huxley-type formulations. Propofol increases the maximal conductance and time constant of decay of the synaptic GABA(A) current. Networks range in size from 2 to 230 neurons. Population output is measured as a function of pyramidal cell activity, with the electroencephalogram approximated by the sum of population AMPA activity between pyramidal cells. These model networks suggest propofol-induced paradoxical excitation may result from a membrane level interaction between the GABA(A) current and an intrinsic membrane slow potassium current (M-current). This membrane level interaction has consequences at the level of multicellular networks enabling a switch from baseline interneuron synchrony to propofol-induced interneuron antisynchrony. Large network models reproduce the clinical EEG changes characteristic of propofol-induced paradoxical excitation. The EEG changes coincide with the emergence of antisynchronous interneuron clusters in the model networks. Our findings suggest interneuron antisynchrony as a potential network mechanism underlying the generation of propofol-induced paradoxical excitation. As correlates of behavioral phenomenology, these networks may refine our understanding of the specific behavioral states associated with general anesthesia.


Figures

Figure 1.
Figure 1.
Small network connection schemes. Pyramidal cells are represented by the letter “e,” and interneurons denoted by the letter “i.” The double arrows represent reciprocal connections. The single arrows indicate one-way connections.
Figure 2.
Figure 2.
Propofol facilitates the formation of antisynchronous clusters of LTS interneurons. A, A raster plot of the spiking times of 200 e-cells (labeled 1–200 on the y-axis) and 30 i-cells (labeled 210–240 on the y-axis) of which 15 are FS cells (black) and 15 are LTS cells (gray). Each spike time is represented by a dot. Low-dose propofol was added to the system at 2200 ms. The LTS cells spontaneously form antisynchronous clusters after the addition of propofol. B, The spectral density taken from the simulated EEG shows a large increase in power in the beta range with the addition of propofol. C, The absolute power of the simulated EEG rises in both the beta1 and beta2 frequency bands and decreases in the lower frequency bands with the addition of propofol. D, An enlarged portion of the raster plot in A after the addition of low-dose propofol shows e-cell spikes tend to cluster between the antisynchronous LTS cell clusters with the majority of e-cells spiking toward the later one-half of the inter-LTS cell cluster interval. E, A histogram of e-cell spike times after the spiking of an LTS cell cluster reveals the majority of e-cells spike between 20 and 50 ms after an LTS cell cluster spikes.
Figure 3.
Figure 3.
FS cells and LTS cells have different network effects in the presence of low-dose propofol. A, A raster plot of 200 e-cells and 20 FS cells shows FS interneurons tend to synchronize in the presence of low-dose propofol added at 2200 ms. B, A raster plot with 200 e-cells and 20 LTS cells shows LTS cells form antisynchronous clusters in the presence of low-dose propofol added at 2200 ms. C, The absolute power of the model EEG rises sharply the beta1 frequency band in the low-dose propofol condition when only FS interneurons are present in the network. D, The absolute power rises most in the beta2 frequency band in the low-dose propofol condition when only LTS interneurons are present in the network.
Figure 4.
Figure 4.
Anesthetic-dose propofol promotes different network behavior in the 230-neuron network than does low-dose propofol. A, A raster plot with 200 e-cells, 15 LTS cells (black), and 15 FS cells (light gray) shows FS cells stop participating in the network rhythm shortly after the addition of an anesthetic dose of propofol, which is added at 2200 ms. In contrast, LTS cells spike in antisynchronous clusters both with low-dose and anesthetic-dose propofol. B, The absolute power in the model EEG is elevated in the beta1 frequency band with both low-dose and anesthetic-dose propofol. However, the anesthetic-dose of propofol correlates with a drop in beta2 and gamma power compared with that seen with low-dose propofol.
Figure 5.
Figure 5.
Two sources of propofol-induced beta emerge from the two-cell network. A, A baseline gamma frequency (33 Hz) population rhythm slows to a beta2 frequency (25 Hz) rhythm with the addition of low-dose propofol at 2200 ms. B, A baseline alpha frequency (9 Hz) population rhythm increases to a beta1 frequency (15 Hz) with the addition of low-dose propofol at 2200 ms. In both cases, the pyramidal cell leads the LTS interneuron by a short synaptic delay both before and after the addition of propofol.
Figure 6.
Figure 6.
Propofol changes the distribution of the frequency of oscillations of two-cell networks. Histograms show the distribution of the frequency of oscillations of 145 independently oscillating two-cell networks at baseline and with low and anesthetic doses of propofol. The system is given a uniform distribution of baseline oscillation frequencies. Spikes were counted over a 4 s time window for each category, and each histogram was constructed using 145 bins. The small amount of variability observed in these histograms most likely results from the short time window over which the spikes were counted.
Figure 7.
Figure 7.
Simulation results of the GABAA conductance (A) and the M-current conductance (B) in a model pyramidal cell at baseline (dashed line) and with low-dose propofol (solid line). Low-dose propofol-induced potentiation of the GABAA conductance results in a greater reduction of the M-current conductance than that caused by the baseline GABAA condition.
Figure 8.
Figure 8.
A, e-cell STRCs to GABAA inhibition both with and without M-current present in the e-cell. GABAA kinetics are simulated at baseline and with low-dose propofol. STRCs for periodically spiking e-cells with spiking cycles varying between 47 ms (dashed line) and 100 ms (dotted line) are shown at baseline (B) and in the presence of low-dose propofol (C).
Figure 9.
Figure 9.
The three-cell network generates beta frequency population spiking with the addition of low-dose propofol by two mechanisms. A, A baseline theta frequency (7 Hz) population rhythm increases to a midbeta frequency (19 Hz) population rhythm with the addition of low-dose propofol. After the addition of propofol, the LTS interneurons form a 19 Hz antisynchronous rhythm. The antisynchronous LTS interneuron rhythm suppresses pyramidal cell spiking. At baseline, all three neurons spike together with the pyramidal cell leading the LTS interneurons by a short synaptic delay. B, A baseline gamma frequency (38 Hz) population rhythm slows to a beta2 frequency (25 Hz) rhythm with the addition of low-dose propofol. The pyramidal cell drives the LTS interneurons to spike synchronously both before and after the addition of propofol. In both sets of simulations, propofol is added at 2200 ms.
Figure 10.
Figure 10.
The effect of the GABAA current on the M-current is both phase dependent and propofol dependent. A, Simulation results show the time course of the M-current conductance during and after an LTS cell spike both without postspiking inhibitory input (dotted line) and when inhibitory input follows spiking with delays of 3 ms (dashed line) and 18 ms (solid line). The postinhibitory reduction in M-current conductance increases as the delay to inhibition lengthens. Postinhibitory rebound spiking occurs with sufficient M-current reduction. B, In the presence of low-dose propofol, short (3 ms) time-to-inhibition can cause significant reduction of the M-current conductance sufficient to produce postinhibitory rebound spiking. C, The lowest value of the postspiking M-current conductance decreases as the time-to-inhibition increases. Low-dose propofol consistently causes a larger decrease in M-current conductance than baseline conditions for all inhibitory input times. D, The time after inhibitory input needed to reach the minimum value of M-current conductance progressively shortens with increasing input delay times. Low-dose propofol speeds up the time to reach the minimum M-current conductance only if the inhibitory input arrives within approximately the first 12 ms after neuronal spiking.
Figure 11.
Figure 11.
Time of the rebound spike of an LTS interneuron given inhibition at various times after spiking. Under baseline conditions, the LTS interneuron will not rebound spike if inhibition comes within the first 14 ms after a spike. Rebound spiking occurs regardless of the time of inhibition in the presence of low-dose propofol.
Figure 12.
Figure 12.
Simulations results of two reciprocally connected LTS interneurons. LTS interneurons are quiescent without perturbation (<2200 ms). External GABAA inhibition is given to one LTS interneuron at 2000 ms. The LTS interneurons respond to GABAA inhibition by forming an antisynchronous rhythm. External AMPA excitation is given to both LTS interneurons at 3500 ms. The LTS interneurons respond to simultaneous AMPA input by returning to their quiescent state.
Figure 13.
Figure 13.
Simulation results show increasing time of block of postexcitatory inhibition with increasing values of the maximal M-current conductance. The maximal M-current conductance is varied in one LTS cell, which is given excitation followed by inhibition at various lag times. The points on the graph show the shortest lag between LTS cell spiking and inhibition at which the LTS cell responds with a rebound spike.
Figure 14.
Figure 14.
Simulation results of the time to rebound spiking after inhibitory input to a quiescent LTS cell with increasing values of maximal M-current conductance.
Figure 15.
Figure 15.
Increasing the pyramidal cell-to-interneuron ratio allows the pyramidal cells to participate in the antisynchronous LTS interneuron rhythm. The population spiking frequency of 10 pyramidal cells and 2 LTS interneurons increases from 11 Hz at baseline to 19 Hz with the addition of low-dose propofol. Propofol is added at 2200 ms. The LTS interneurons spike synchronously at 11 Hz at baseline and form an antisynchronous 19 Hz population rhythm with low-dose propofol. One or more pyramidal cells lead the LTS interneurons in both the baseline and low-dose propofol cases.

References

    1. Adodra S, Hales TG. Potentiation, activation and blockade of GABAA receptors of clonal murine hypothalamic GT1–7 neurones by propofol. Br J Pharmacol. 1995;115:953–960. - PMC - PubMed
    1. Bai D, Pennefather PS, MacDonald JF, Orser BA. The general anesthetic propofol slows deactivation and desensitization of GABAA receptors. J Neurosci. 1999;19:10635–10646. - PMC - PubMed
    1. Baker MR, Baker SN. The effect of diazepam on motor cortical oscillations and corticomuscular coherence studies in man. J Physiol. 2003;546:931–942. - PMC - PubMed
    1. Borgeat A, Dessibourg C, Popovic V, Meier D, Blanchard M, Schwander D. Propofol and spontaneous movements: an EEG study. Anesthesiology. 1991;74:24–27. - PubMed
    1. Borgeat A, Fuchs T, Tassonyi E. Induction characteristics of 2% propofol in children. Br J Anaesth. 1997;78:433–435. - PubMed

MeSH terms