. 2008 Dec 10;28(50):13522-31.
doi: 10.1523/JNEUROSCI.4390-08.2008.

The neural basis for combinatorial coding in a cortical population response

Affiliations

The neural basis for combinatorial coding in a cortical population response

Leslie C Osborne et al. J Neurosci. .

Abstract

We have used a combination of theory and experiment to assess how information is represented in a realistic cortical population response, examining how motion direction and timing is encoded in groups of neurons in cortical area MT. Combining data from several single-unit experiments, we constructed model population responses in small time windows and represented the response in each window as a binary vector of 1s or 0s signifying spikes or no spikes from each cell. We found that patterns of spikes and silence across a population of nominally redundant neurons can carry up to twice as much information about visual motion than does population spike count, even when the neurons respond independently to their sensory inputs. This extra information arises by virtue of the broad diversity of firing rate dynamics found in even very similarly tuned groups of MT neurons. Additionally, specific patterns of spiking and silence can carry more information than the sum of their parts (synergy), opening up the possibility for combinatorial coding in cortex. These results also held for populations in which we imposed levels of nonindependence (correlation) comparable to those found in cortical recordings. Our findings suggest that combinatorial codes are advantageous for representing stimulus information on short time scales, even when neurons have no complicated, stimulus-dependent correlation structure.


Figures

Figure 1.
Figure 1.
Utility of patterns of spiking and silence across a diverse population of MT neurons for providing information about a target motion stimulus. A, The normalized tuning curves of four MT neurons, showing firing rate versus direction of motion. Data were normalized by the response to the preferred direction, relative to which all other directions are measured. deg, Degrees. B, Method for creating words to indicate spiking and silences across a population of neurons, in 8 ms windows. In this example, the population response at time t is characterized by the word “01010.” C, The information that counts and words carry about the visual motion stimulus plotted as a function of the number of neurons in the analysis population. Error bars indicate SD.
Figure 2.
Figure 2.
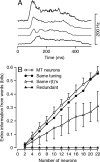
Combinatorial coding is enabled by a diversity of response dynamics. A, Responses of the same four neurons as in Figure 1A, plotting rate (from peristimulus time histogram) versus time in response to a 256 ms step of target speed in the preferred direction. Firing rate curves have been offset horizontally to improve visibility. B, Extra information from words versus counts is plotted as a function of the number of neurons in the analysis population. Different symbols show the results from populations of real and model neurons with different features made redundant. Open circles, Data drawn from actual single-trial responses; filled circles, diversity of response dynamics in model neurons mimics that in the data, but each neuron has been made to have the same tuning curve width; open triangles, model neurons that have the same time-varying firing rate, but response amplitude varies as in the actual data; filled triangles, model neurons that have the same time-varying firing rate and direction-dependent response amplitudes but are independent Poisson processes. Error bars indicate SD.
Figure 3.
Figure 3.
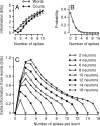
Added information from words analyzed separately for each spike count. A, Comparison of information from patterns of spiking and silences versus counts as a function of the number of spikes in the analysis window. Information from words was calculated by averaging the information from words of a given count. B, The probability of observing each given spike count in 100 populations of 10 MT neurons. C, Information from words minus information from counts is plotted separately for each spike count and each number of neurons in the analysis population. Connected sets of symbols show data for all counts in a given population size. Error bars indicate SD.
Figure 4.
Figure 4.
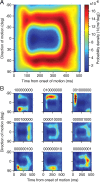
Response conditional stimulus ensembles for binary code words corresponding to a spike count of n = 1 in a population of N = 9 neurons. A, The distribution of directions of motion and delays from motion onset, P(θ,ttonset | n), given that the population of cells produced a total of one spike in window of size Δτ = 8 ms. B, The same analysis, but now performed separately for each combination of spiking and silence in which one neuron emitted a spike and all the others were silent. The probabilities in A have been normalized so that the total integrated probability in the square is unity, with red representing the highest and dark blue representing the lowest values. The distributions in the small panels are probability densities for the stimulus conditioned on those particular one-spike events, multiplied by the probability of that event so that the average of all nine small panels yields the distribution in A. Graphs are based on analysis of draws from actual data in one group of nine MT neurons. N = 9 was chosen to allow the 3 × 3 presentation. deg, Degrees.
Figure 5.
Figure 5.
Contributions of silences in other neurons to the distribution of stimuli conditional on a spike in one neuron. Each pixel indicates the relative probability of a given direction of target motion at a given time after the onset of target motion, given a particular word of spiking and silences across a population of nine MT neurons. Probability densities are normalized to the peak, indicated by dark red, for each pattern. The string above each color map indicates the word that was used to create each response conditional ensemble, in which a 1 or 0 indicates the presence or absence of a spike in a neuron and an asterisk indicates a wildcard so that an interval was included in the average whether a spike was present or absent. Additional analysis revealed that the 100000000 and 1******** words contain 0.71 and 0.44 bits of information, respectively, about the stimulus. deg, Degrees.
Figure 6.
Figure 6.
Impact of neuron–neuron correlations on coding based on population patterns of spikes and silence versus spike counts. The values on the x-axis are the calculated correlations between pairs of separately sampled units after setting up correlated populations using Equations 4–6. Filled and open circles show information about the stimulus from counts versus patterns of spiking and silence, respectively. Data are shown as means and SDs across 50 groups of N = 10 cells drawn from our experimental sample of 36 neurons.

References

    1. Abbott LF. Decoding neuronal firing and modeling neural networks. Q Rev Biophys. 1994;27:291–331. - PubMed
    1. Abbott LF, Dayan P. The effect of correlated variability on the accuracy of a population code. Neural Comput. 1999;11:91–101. - PubMed
    1. Adrian ED. The impulses produced by sensory nerve endings: Part I. J Physiol. 1926;61:49–72. - PMC - PubMed
    1. Aertsen AM, Gerstein GL, Habib MK, Palm G. Dynamics of neuronal firing correlation: modulation of “effective connectivity.”. J Neurophysiol. 1989;61:900–917. - PubMed
    1. Albright TD, Desimone R, Gross CG. Columnar organization of directionally selective cells in visual area MT of the macaque. J Neurophysiol. 1984;51:16–31. - PubMed

Publication types