. 2008 Dec 10;28(50):13696-702.
doi: 10.1523/JNEUROSCI.3872-08.2008.

Neural substrates of sound-touch synesthesia after a thalamic lesion

Affiliations

Neural substrates of sound-touch synesthesia after a thalamic lesion

Michael S Beauchamp et al. J Neurosci. .

Abstract

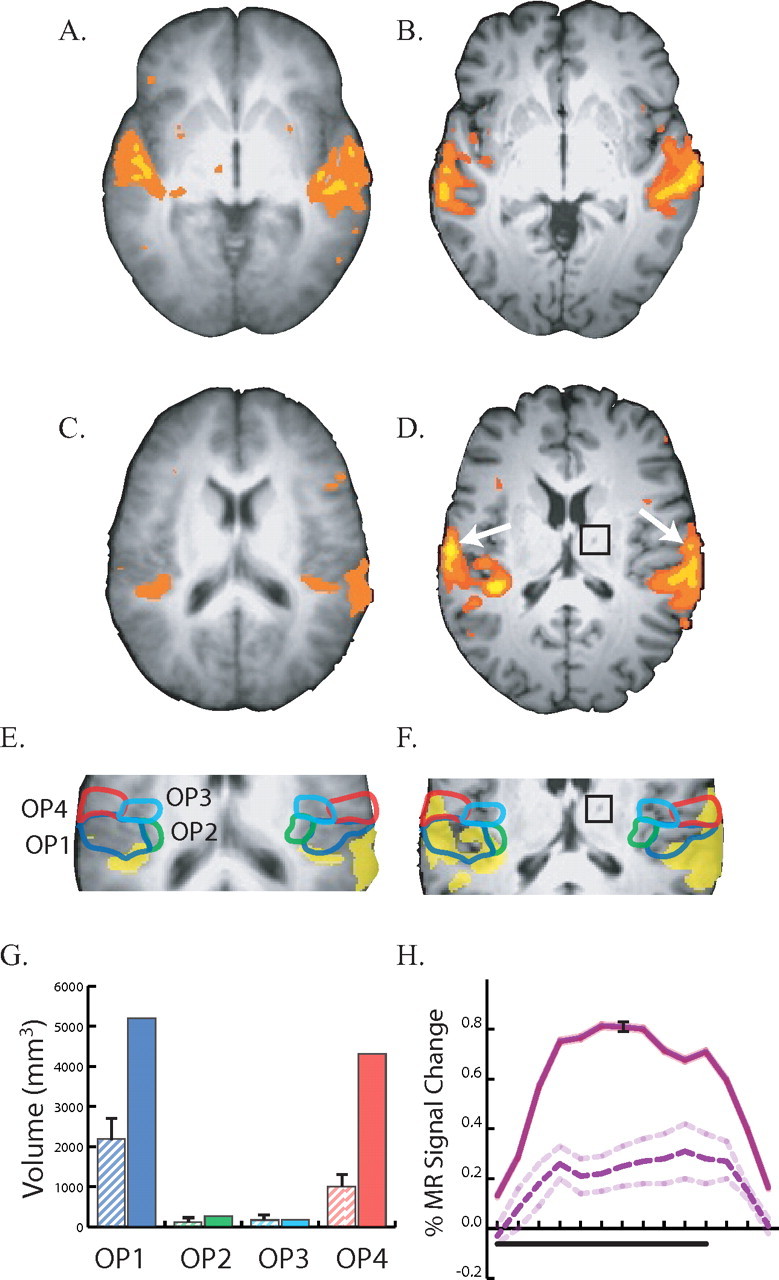
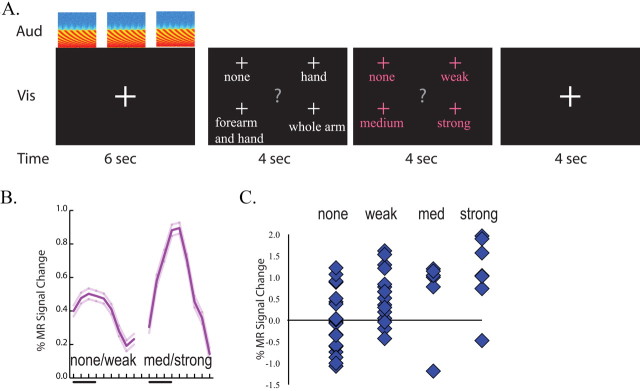
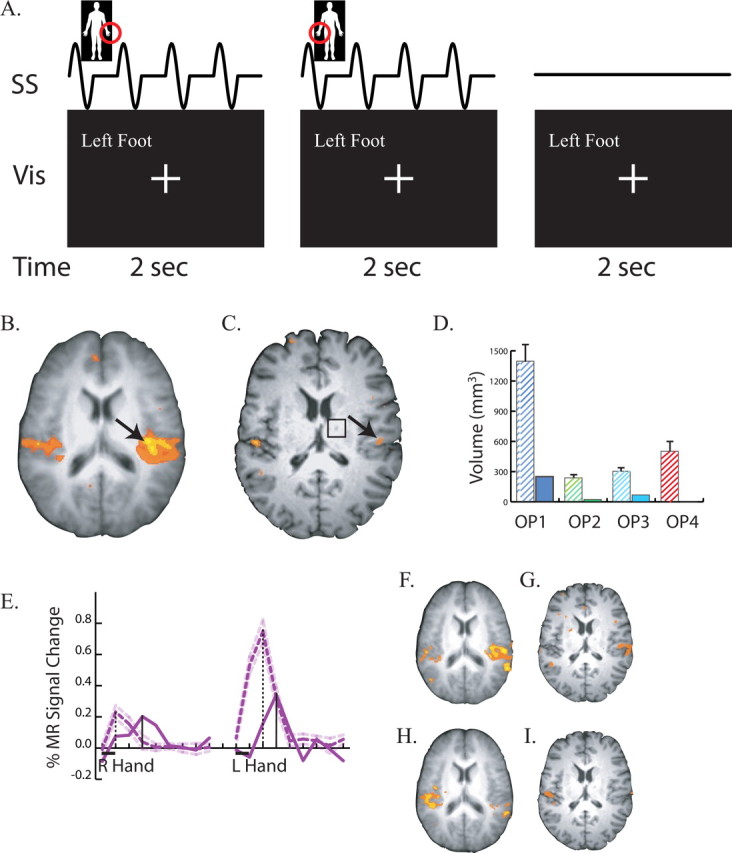
Neural plasticity induced by stroke can mediate positive outcomes, such as recovery of function, but can also result in the formation of abnormal connections with negative consequences for perception and cognition. In three experiments using blood-oxygen level dependent (BOLD) functional magnetic resonance imaging, we examined the neural substrates of acquired auditory-tactile synesthesia, in which certain sounds can produce an intense somatosensory tingling sensation in a patient with a thalamic lesion. Compared with nine normal controls, the first experiment showed that the patient had a threefold greater BOLD response to sounds in the parietal operculum, the location of secondary somatosensory cortex. We hypothesized that this abnormal opercular activity might be the neural substrate of the patient's synesthesia. Supporting this hypothesis, the second experiment demonstrated that sounds that produced no somatosensation did not evoke a BOLD response in the operculum, while sounds that produced strong somatosensations evoked large BOLD responses. These abnormal responses may have resulted from plasticity induced by the loss of somatosensory inputs. Consistent with this idea, in the third experiment, BOLD responses to somatosensory stimulation were significantly weaker in the patient's operculum than in normal controls. These experiments demonstrate a double dissociation in the patient's secondary somatosensory cortex (increased responses to auditory stimulation and decreased responses to somatosensory stimulation), and suggest both that stroke-induced plasticity can result in abnormal connections between sensory modalities that are normally separate, and that synesthesia can be caused by inappropriate connections between nearby cortical territories.


Figures

Figure 1.
Figure 1.
Responses to auditory stimulation in controls (A, C, E) and the patient (B, D, F). A, An axial slice at the location of auditory cortex (z = 0 mm). Underlay shows average anatomical dataset from nine normal controls; colored voxels show significant responses to auditory stimulation (p < 0.01 corrected). Left is left in all figures. B, Responses to auditory stimulation in auditory cortex (z = 0 mm) of the patient. C, An axial slice through secondary somatosensory cortex (z = 17 mm) in the parietal operculum in an average control dataset, showing weak auditory responses. D, Strong auditory responses in the patient's operculum (z = 17 mm), highlighted with white arrows. The black square shows the location of the thalamic lesion in the patient's right thalamus. E, Enlarged view of the operculum in normal controls. Active voxels are colored yellow; colored outlines show cytoarchitectonic subdivisions of the operculum. Blue line, OP1; green line, OP2; cyan line, OP3; red line, OP4. F, Enlarged view of opercular auditory responses in the patient with cytoarchitectonic boundaries (black square shows thalamic lesion). G, Volume of cortex responding to auditory stimulation in four cytoarchitectonic subdivisions of the operculum. The label under each pair of bars identifies the subdivision. The left hatched bar in each pair shows the mean ± SEM volume in nine normals; the right solid bar shows the volume in the patient; bar colors correspond to outline colors in E. H, Evoked response to auditory stimulation. Black bar under x-axis shows duration of a block of 10 different 2 s auditory stimuli. Solid purple line shows mean time series from OP1 and OP4 in the patient (black error bars show SEM). Dashed purple line shows mean time series from OP1 and OP4 in nine normal controls (dashed line shows SEM).
Figure 2.
Figure 2.
Correlation of BOLD fMRI signal with perception in synesthesia. A, Stimulus and task paradigm. Each trial contained four epochs. The first epoch consisted of three presentations of the same auditory stimulus (shown by spectrograms in row labeled “Aud”) and a visual fixation screen (row labeled “Vis”) for a duration of 6 s (row labeled “Time”). In the second epoch, the patient fixated a word corresponding to the location of the somatosensory percept (if any). In the third epoch, the patient fixated the intensity of the somatosensory percept. In the fourth epoch, the subject fixated (resting baseline). B, Average response to trials, classified by whether they evoked none or a weak somatosensory percept (left trace, mean response of OP1 and OP4 voxels ±SEM) or a medium or strong somatosensory percept (right trace). C, The amplitude of the fMRI signal to single trials classified by the strength of the evoked somatosensory percepts.
Figure 3.
Figure 3.
Responses to somatosensory stimulation. A, Stimulus and task paradigm. Three successive 2 s trials are shown. The somatosensory stimulus (row labeled “SS”) consisted of four repetitions of 200 Hz vibrotactile stimulation within a 250 ms ON/250 ms OFF square wave envelope delivered to the body part circled in red (left hand in first trial, right hand in second trial, no stimulation in third trial). The visual stimulus (labeled “Vis”) was identical in all trials. The behavioral task was to fixate the central crosshairs at all times, except when the left foot was stimulated, when the subject fixated the words “Left Foot.” B, An axial slice at the location of secondary somatosensory cortex in the operculum. Underlay shows average anatomical dataset from nine normal controls; colored voxels show significant responses to somatosensory stimulation (p < 0.01 corrected). Black arrow highlights strong opercular activity. C, Responses to somatosensory stimulation in the patient's operculum. Black arrow highlights weak activity. Black square shows location of right thalamic lesion. D, Volume of cortex responding to somatosensory stimulation in four cytoarchitectonic subdivisions of the operculum. The left hatched bar in each pair shows the mean ± SEM volume in nine normal controls; the right solid bar in each pair shows the patient. The label under each pair of bars identifies the subdivision. E, BOLD fMRI time course of the response to somatosensory stimulation. The black bar under the x-axis shows the duration of the 2 s stimulation trial for right hand stimulation (left trace) and left hand stimulation (right trace). Purple lines show the deconvolved event-related time series representing the average response to a single trial. Solid purple line shows the signal change in the peak operculum voxel of the patient (black arrow in C). Dashed purple line shows the peak signal change (mean ± SEM) in nine normal controls. Vertical black lines show the latency of the peak of the response (solid bar for patient, dashed bar for patient). F, Responses to left hand stimulation in the operculum of normal controls. G, Responses to left hand stimulation in the patient. H, Responses to right hand stimulation in the operculum of normal controls. I, Responses to right hand stimulation in the patient.

References

    1. Aglioti S, Cortese F, Franchini C. Rapid sensory remapping in the adult human brain as inferred from phantom breast perception. Neuroreport. 1994;5:473–476. - PubMed
    1. Argall BD, Saad ZS, Beauchamp MS. Simplified intersubject averaging on the cortical surface using SUMA. Hum Brain Mapp. 2006;27:14–27. - PMC - PubMed
    1. Armel KC, Ramachandran R. Acquired synesthesia in retinitis pigmentosa. Neurocase. 1999;5:293–296.
    1. Beauchamp MS, Lee KE, Argall BD, Martin A. Integration of auditory and visual information about objects in superior temporal sulcus. Neuron. 2004a;41:809–823. - PubMed
    1. Beauchamp MS, Argall BD, Bodurka J, Duyn JH, Martin A. Unraveling multisensory integration: patchy organization within human STS multisensory cortex. Nat Neurosci. 2004b;7:1190–1192. - PubMed