. 2009 Mar;132(Pt 3):722-33.
doi: 10.1093/brain/awn333. Epub 2008 Dec 11.

Walking flexibility after hemispherectomy: split-belt treadmill adaptation and feedback control

Affiliations

Walking flexibility after hemispherectomy: split-belt treadmill adaptation and feedback control

Julia T Choi et al. Brain. 2009 Mar.

Abstract

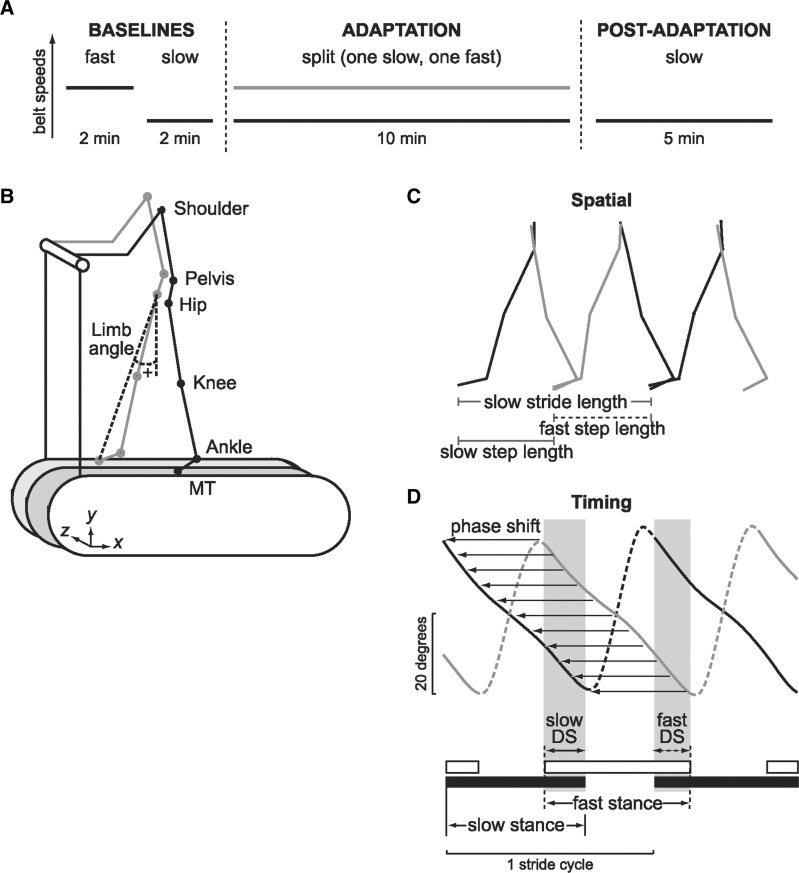
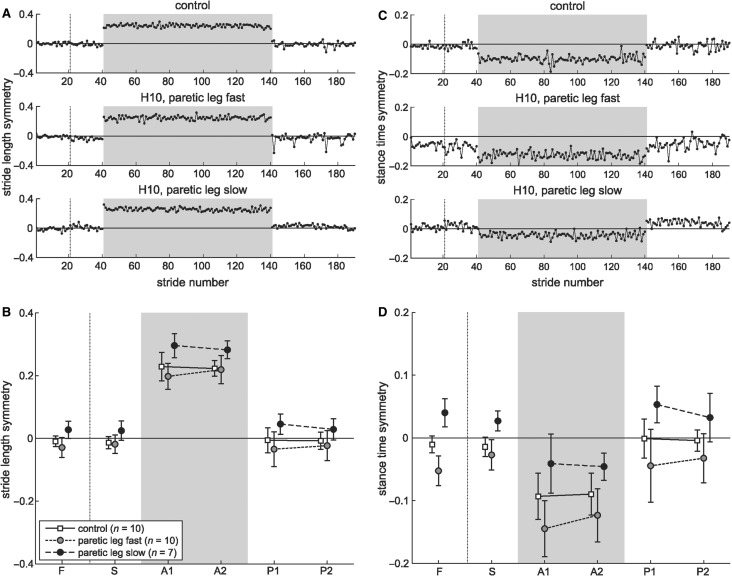
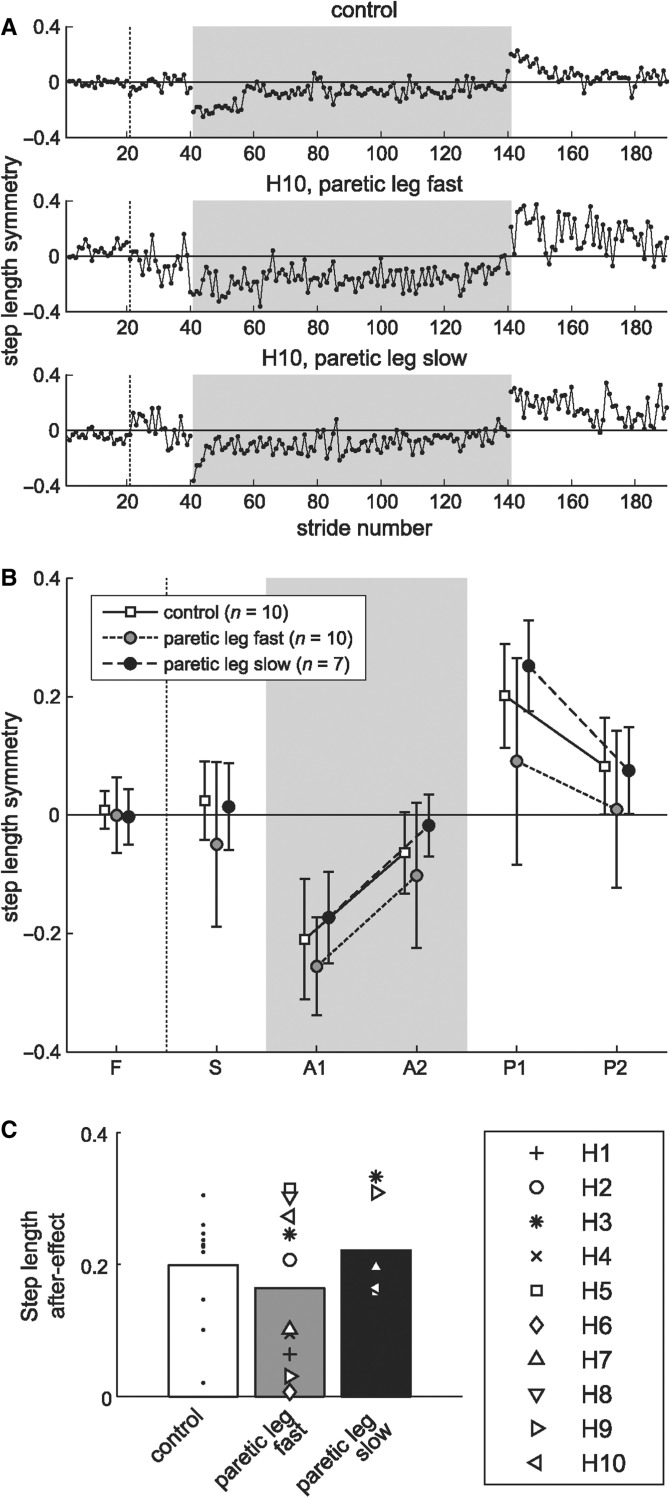
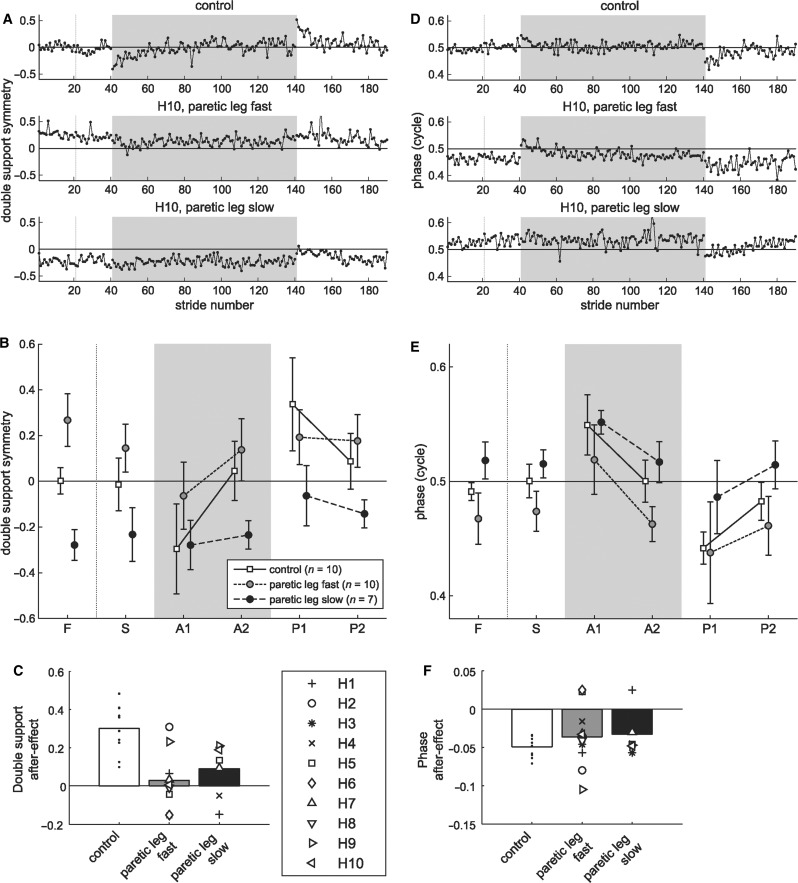
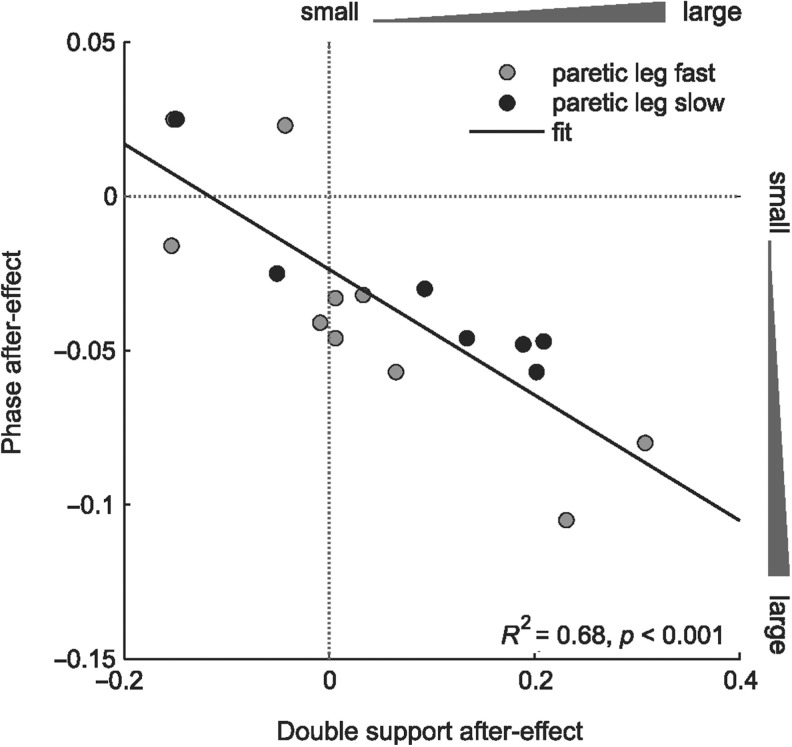
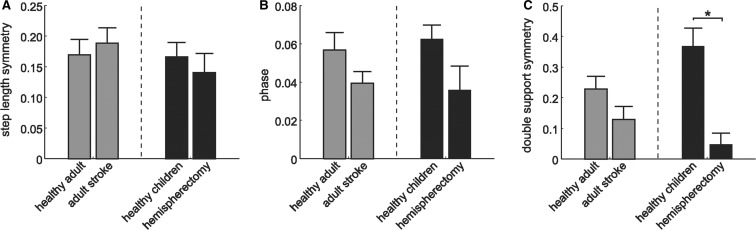
Walking flexibility depends on use of feedback or reactive control to respond to unexpected changes in the environment, and the ability to adapt feedforward or predictive control for sustained alterations. Recent work has demonstrated that cerebellar damage impairs feedforward adaptation, but not feedback control, during human split-belt treadmill walking. In contrast, focal cerebral damage from stroke did not impair either process. This led to the suggestion that cerebellar interactions with the brainstem are more important than those with cerebral structures for feedforward adaptation. Does complete removal of a cerebral hemisphere affect either of these processes? We studied split-belt walking in 10 children and adolescents (age 6-18 years) with hemispherectomy (i.e. surgical removal of one entire cerebral hemisphere) and 10 age- and sex-matched control subjects. Hemispherectomy did not impair reactive feedback control, though feedforward adaptation was impaired in some subjects. Specifically, some showed reduced or absent adaptation of inter-leg timing, whereas adaptation of spatial control was intact. These results suggest that the cerebrum is involved in adaptation of the timing, but not spatial, elements of limb movements.


Figures

Figure 1
Figure 1
Experimental paradigm and walking measurements. (A) Experimental paradigm consisting of Baselines, Adaptation and Post-adaptation periods. (B) Stick figure illustrates marker location (dots) and limb angle. (C) Spatial aspects of walking are measured by calculating stride length and step lengths. Stride length in treadmill walking is the distance travelled by ankle marker from foot contact to lift off, and step length is the distance between left and right ankle markers at time of foot contact. (D) Temporal aspects of walking are measured by calculating stance time and double support time. Horizontal bars represent stance (time from foot contact to lift off) for the slow leg (black bar) and fast leg (white bar). Double support is the period when both legs are in stance. Another temporal measure is interlimb phasing, determined by calculating the cross-correlation function between limb angle trajectories for the slow leg (black line) and fast leg (grey line). Interlimb phase was defined as the lag time at peak correlation. While double support captures timing of foot contact, interlimb phase depends on the time shift (thin arrows) and trajectory of limb kinematics across the whole stride cycle.
Figure 2
Figure 2
Feedback control: ability to make immediate reactive responses. Stride-by-stride values for stride length symmetry (A) and stance time symmetry (C) from a typical control (top row) and hemispherectomy subject (bottom two rows) for the first 20 strides of fast and slow baselines, first 100 strides of split-belt adaptation, and first 60 strides of post-adaptation. Zero indicates symmetric stride length or stance time, negative value indicates that stride length or stance time on the fast leg is shorter relative to slow leg. Dotted vertical line indicates stop between fast and slow baseline. Shaded area indicates split-belts condition. Group averages for stride length (B) and stance time symmetry (D) during baseline conditions (slow, S and fast, F), split-belt adaptation (early, A1 and late, A2) and post-adaptation (early, P1 and late P2) for control (white squares) and hemispherectomy group with paretic leg fast (grey circles) or paretic leg slow (black circles). Each data point represents mean ± 1 SD over five strides. Note that symmetry index was always calculated with the slow leg as reference. Since we tested hemispherectomy subjects with their paretic leg fast in one experiment and slow in another, the symmetry index reversed sign at baseline due to this convention (grey versus black circles).
Figure 3
Figure 3
Feedforward adaptation: measured by the presence of after-effects. (A) Stride-by-stride values for step length from a typical control (top row) and hemispherectomy subject (bottom two rows) for the first 20 strides of fast and slow baseline, first 100 strides of split-belt adaptation, and first 60 strides of post-adaptation. Zero indicates symmetric step length; negative value indicates that step length on fast leg is shorter relative to slow leg. Shaded area indicates split-belts condition. (B) Group averages for step length during baseline conditions (slow, S and fast, F), split-belt adaptation (early, A1 and late, A2) and post-adaptation (early, P1 and late P2) for control (white squares) and hemispherectomy group with paretic leg fast (grey circles) or paretic leg slow (black circles). Each data point represents mean ± 1 SD over five strides. (C) Post-adaptation after-effects relative to baseline (P1 minus S). Bars represent mean after-effect in control (white) and hemispherectomy subjects with paretic leg fast (grey) or paretic leg slow (black), with individual data overlaid. The presence of an after-effects indicated involvement of a feedforward adaptation.
Figure 4
Figure 4
Feedforward adaptation of temporal parameters. Stride-by-stride double support symmetry (A) and interlimb phase (D) from a typical control (top row) and hemispherectomy subject (bottom two rows) for the first 20 strides of fast and slow baselines, first 100 strides of split-belt adaptation (grey shaded area), and first 60 strides of post-adaptation. For double support, zero indicates symmetry and negative values indicates shorter double support on fast leg relative to slow leg. For interlimb phase, 0.5 indicates out of phase coordination and a positive value indicates phase lead by the fast leg. (B and E) Group averages during baseline tied-belts conditions (slow, S and fast, F), split-belt adaptation (early, A1 and late, A2) and post-adaptation (early, P1 and late P2) for the control (white squares) and hemispherectomy group with paretic leg fast (grey circles) or paretic leg slow (black circles). Each data point represents mean ± 1 SD over five strides. (C and F) Post-adaptation after-effects relative to baseline (P1 minus S). Bars represent mean after-effects in control (white) and hemispherectomy subjects with paretic leg fast (grey) or paretic leg slow (black), with individual data is overlaid. The presence of after-effects indicated involvement of feedforward adaptation. Note that by convention, the slow leg was always used as reference. Values at baseline differ (grey versus black circles) since hemispherectomy subjects were trained with paretic leg fast in one experiment and paretic leg slow in another.
Figure 5
Figure 5
Relationship between adaptation of double support and interlimb phase. Each data point represents the after-effect in double support (x-axis) and phase (y-axis) for individual hemispherectomy subjects trained with paretic leg fast (grey circles) or paretic leg slow (black circles). There is a clear correlation (linear fit) between the two temporal parameters, where smaller after-effect in double support corresponded with smaller after-effect in phase. Notice offset in this relationship (i.e. line shifted left of origin). Some hemispherectomy subjects had small after-effect in double support, yet showed after-effect in phase.
Figure 6
Figure 6
Comparison between the after-effects from split-belt training in stroke and hemispherectomy subjects. After-effects in step length symmetry (A), interlimb phase (B) and double support symmetry (C) for stoke subjects (left) and hemispherectomy subjects (right) with their respective matched controls. Error bars indicate ± SE. *P < 0.05.

References

    1. Armstrong DM. Supraspinal contributions to the initiation and control of locomotion in the cat. Prog Neurobiol. 1986;26:273–361. - PubMed
    1. Baron JC, Bousser MG, Comar D, Castaigne P. Crossed cerebellar diaschisis in human supratentorial brain infarction. Ann Neurol. 1980;8:128. - PubMed
    1. Batschelet E. London: Academic Press; 1981. Circular Statistics in Biology.
    1. Benecke R, Meyer BU, Freund HJ. Reorganisation of descending motor pathways in patients after hemispherectomy and severe hemispheric lesions demonstrated by magnetic brain stimulation. Exp Brain Res. 1991;83:419–26. - PubMed
    1. Berger W, Altenmueller E, Dietz V. Normal and impaired development of children's gait. Hum Neurobiol. 1984;3:163–70. - PubMed

Publication types