. 2008 Dec 23;105(51):20517-22.
doi: 10.1073/pnas.0810524105. Epub 2008 Dec 12.

Dynamic cross-frequency couplings of local field potential oscillations in rat striatum and hippocampus during performance of a T-maze task

Affiliations

Dynamic cross-frequency couplings of local field potential oscillations in rat striatum and hippocampus during performance of a T-maze task

Adriano B L Tort et al. Proc Natl Acad Sci U S A. .

Abstract

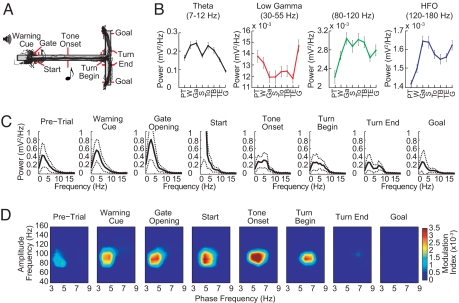
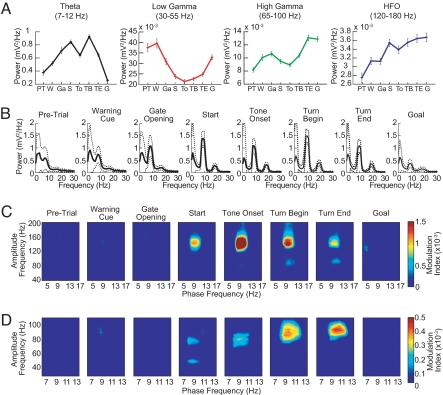
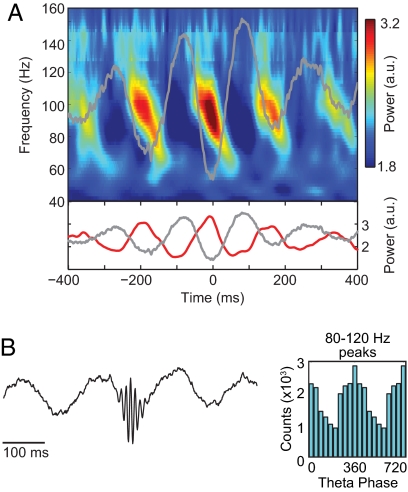
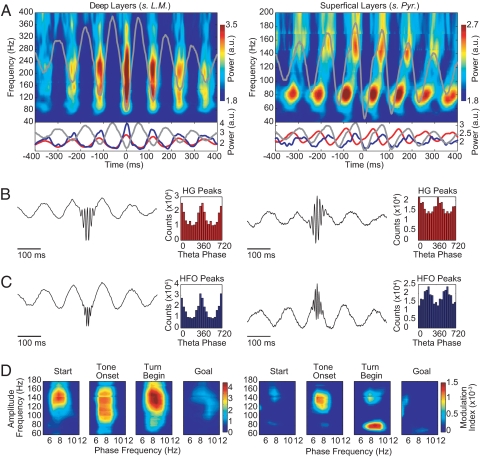
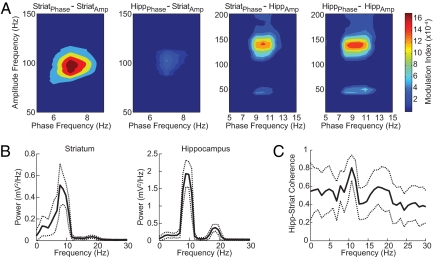
Oscillatory rhythms in different frequency ranges mark different behavioral states and are thought to provide distinct temporal windows that coherently bind cooperating neuronal assemblies. However, the rhythms in different bands can also interact with each other, suggesting the possibility of higher-order representations of brain states by such rhythmic activity. To explore this possibility, we analyzed local field potential oscillations recorded simultaneously from the striatum and the hippocampus. As rats performed a task requiring active navigation and decision making, the amplitudes of multiple high-frequency oscillations were dynamically modulated in task-dependent patterns by the phase of cooccurring theta-band oscillations both within and across these structures, particularly during decision-making behavioral epochs. Moreover, the modulation patterns uncovered distinctions among both high- and low-frequency subbands. Cross-frequency coupling of multiple neuronal rhythms could be a general mechanism used by the brain to perform network-level dynamical computations underlying voluntary behavior.


Conflict of interest statement

The authors declare no conflict of interest.

Figures

Fig. 1.
Fig. 1.
Dynamic amplitude modulation of fast LFP rhythms by theta phase in the striatum during maze runs. (A) T-maze with task events and run trajectories from a representative session with 39 trials. Red markers show photobeam positions. (B) Average power of striatal oscillations for successive event windows (1 s) over 4 frequency ranges of interest. Error bars represent SEM. Event labels: PT, pre-trial; W, warning cue; Ga, gate opening; S, start; To, tone onset; TB, turn begin; TE, turn end; G, goal reaching. (C) Mean power spectra (solid lines) showing characteristic changes in the power peak during perievent windows. Dashed lines represent ±SD. (D) Phase-to-amplitude comodulograms plotted for each task-event window. Pseudocolor scale represents modulation index values shown at right. Positive values indicate a statistically significant (P < 0.01) phase-to-amplitude cross-frequency coupling (see SI Text). Results illustrated in B–D were obtained from a striatal tetrode in a representative rat by analyzing all trials in the session shown in A.
Fig. 2.
Fig. 2.
Phase-to-amplitude modulation in the hippocampus. (A) Average power of hippocampal oscillations recorded in CA1 and plotted for each task-event window over 4 frequency ranges of interest. Events are labeled as in Fig. 1B. (B). Mean power spectra recorded during the successive task epochs. (C and D) Phase-to-amplitude comodulograms obtained from LFPs recorded during the distinct task-event windows shown. Plots in C show amplitude modulation of rhythms over the entire high-frequency range studied (40–200 Hz). Plots in D show modulation in the high frequency range focused on gamma, from 30 to 110 Hz. Results illustrated in A–D were obtained from a tetrode in the superficial layer of CA1 in a representative rat by analyzing all trials (n = 40) in a session.
Fig. 3.
Fig. 3.
The amplitude of striatal 80–120 Hz LFP oscillations is maximal at the troughs of cooccurring striatal theta oscillations. (A) (Upper) Time–frequency plot of the mean normalized power time-locked to the theta (5–8 Hz) trough. (Lower) Plot showing the mean normalized power at 100 Hz (red line). The theta trough-locked averaged raw signal is shown in both Upper and Lower plots as a gray line. (B) (Left) Averaged raw signal obtained by aligning the LFP traces at the peaks of the 80- to 120-Hz oscillation (see SI Text). (Right) The histogram of the theta phases at which the peaks occurred. Results were obtained from the same animal and experimental session as in Fig. 1.
Fig. 4.
Fig. 4.
The theta phase modulation of high-frequency hippocampal LFP oscillations differs for rhythms in different frequency bands and layers in the CA1 region of the dorsal hippocampus. (A) (Upper) Time–frequency plots of the mean normalized power time-locked to the theta (7–12 Hz) trough for the deep (Left) and superficial (Right) CA1 layers recordings. (Lower) Plots showing the mean normalized power at 80 Hz (HG, red line) and at 160 Hz (HFO, blue line). The theta trough-locked averaged raw signal is shown in gray in all plots. (B and C) Averaged raw signal obtained by centering the LFP traces at the peaks of the HG (B) or HFO (C) and the corresponding histograms of the theta phases at which the peaks occurred. (D) Phase-to-amplitude comodulograms showing differential theta modulations of HG and HFO rhythms. Results are shown for simultaneous recordings from 1 deep (left column) and 1 superficial (right column) CA1 layer tetrode in a representative rat.
Fig. 5.
Fig. 5.
Phase-amplitude couplings occur between simultaneously recorded striatal and hippocampal oscillations. (A) Phase-to-amplitude comodulograms obtained during a 1-s interval around the Tone Onset task event. Results are shown for all phase–amplitude combinations as labeled. Note that the theta phase in each structure modulates the amplitude of oscillations in the other structure. (B) Mean power spectrum (solid line) of the LFPs recorded in each brain region during the same task period (Tone Onset), showing a peak in the theta band in both regions. Dashed lines represent ±SD. (C) Coherence spectrum (solid line) between the striatal and the hippocampal oscillations during the same task period showing a peak of coherence at ≈10 Hz. Results were obtained from a representative animal during a session (different rat than in Fig. 1).

References

    1. Buzsaki G. Rhythms of the Brain. Oxford: Oxford Univ Press; 2006.
    1. Buzsaki G, et al. Hippocampal network patterns of activity in the mouse. Neuroscience. 2003;116:201–211. - PubMed
    1. Bragin A, et al. Gamma (40–100 Hz) oscillation in the hippocampus of the behaving rat. J Neurosci. 1995;15:47–60. - PMC - PubMed
    1. Hentschke H, Perkins MG, Pearce RA, Banks MI. Muscarinic blockade weakens interaction of gamma with theta rhythms in mouse hippocampus. Eur J Neurosci. 2007;26:1642–1656. - PubMed
    1. Kahana MJ, Sekuler R, Caplan JB, Kirschen M, Madsen JR. Human theta oscillations exhibit task dependence during virtual maze navigation. Nature. 1999;399:781–784. - PubMed

Publication types