. 2009 Jan 16;323(5912):401-4.
doi: 10.1126/science.1163183. Epub 2008 Dec 11.

Chromatin-associated periodicity in genetic variation downstream of transcriptional start sites

Affiliations

Chromatin-associated periodicity in genetic variation downstream of transcriptional start sites

Shin Sasaki et al. Science. .

Abstract

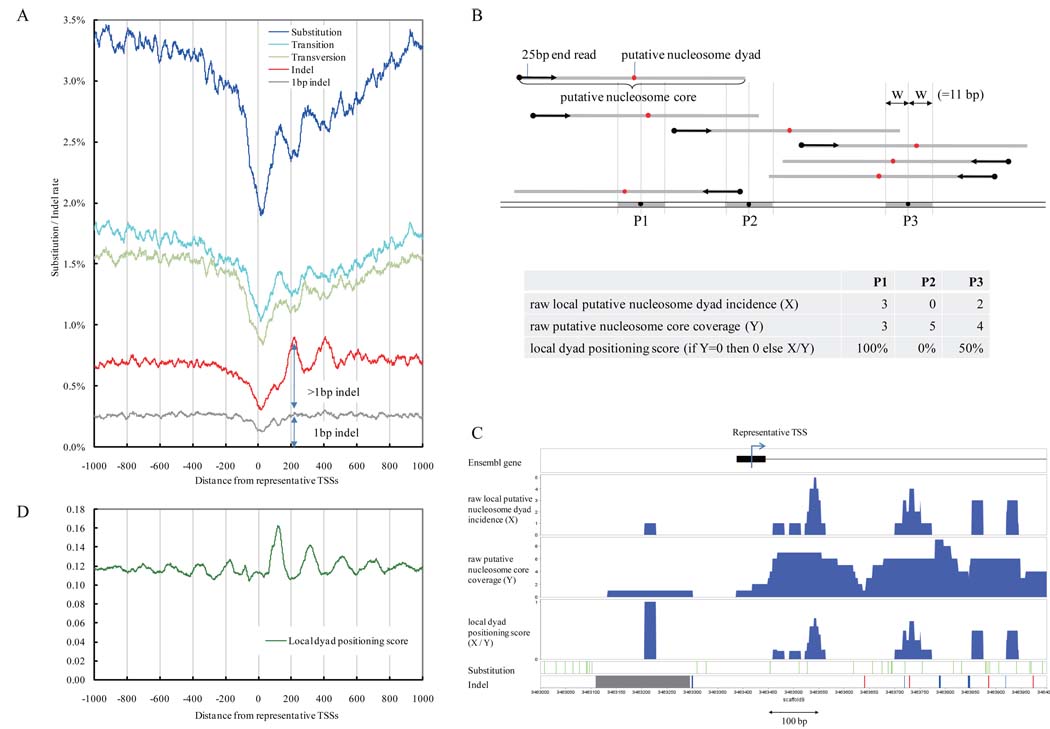
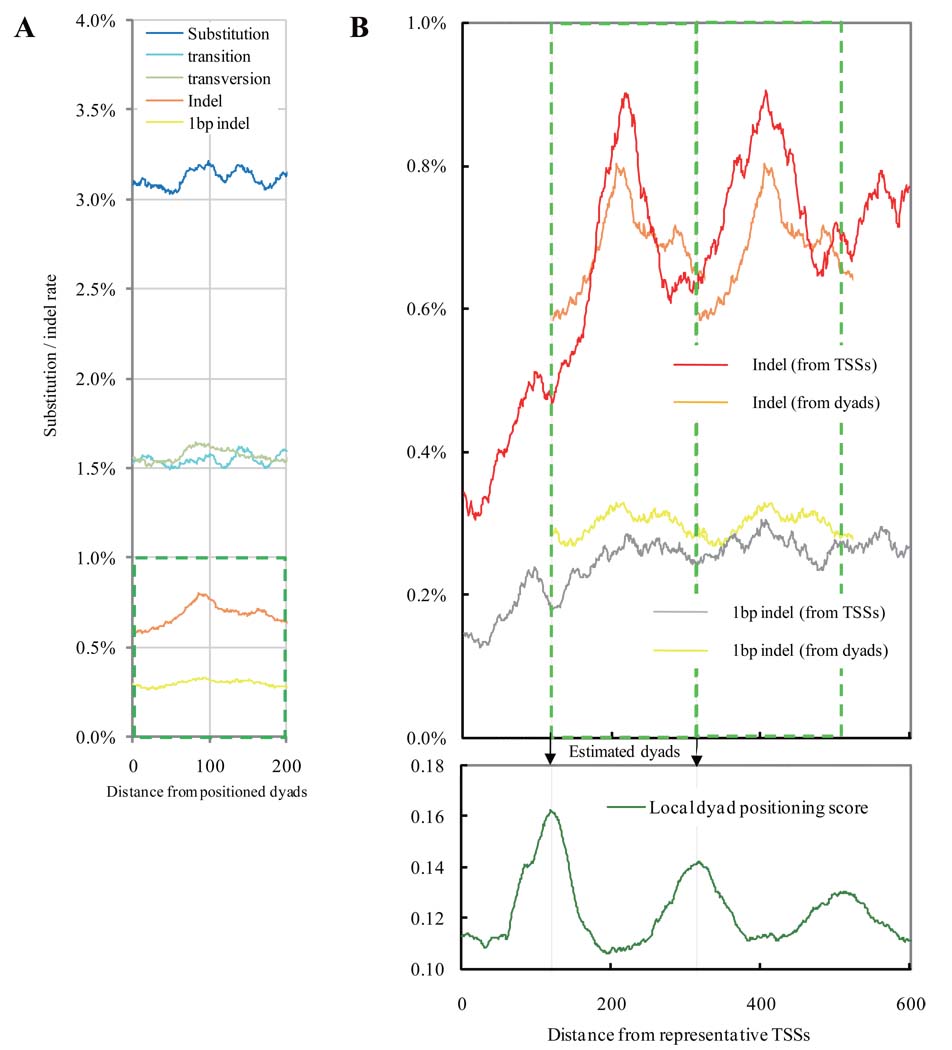
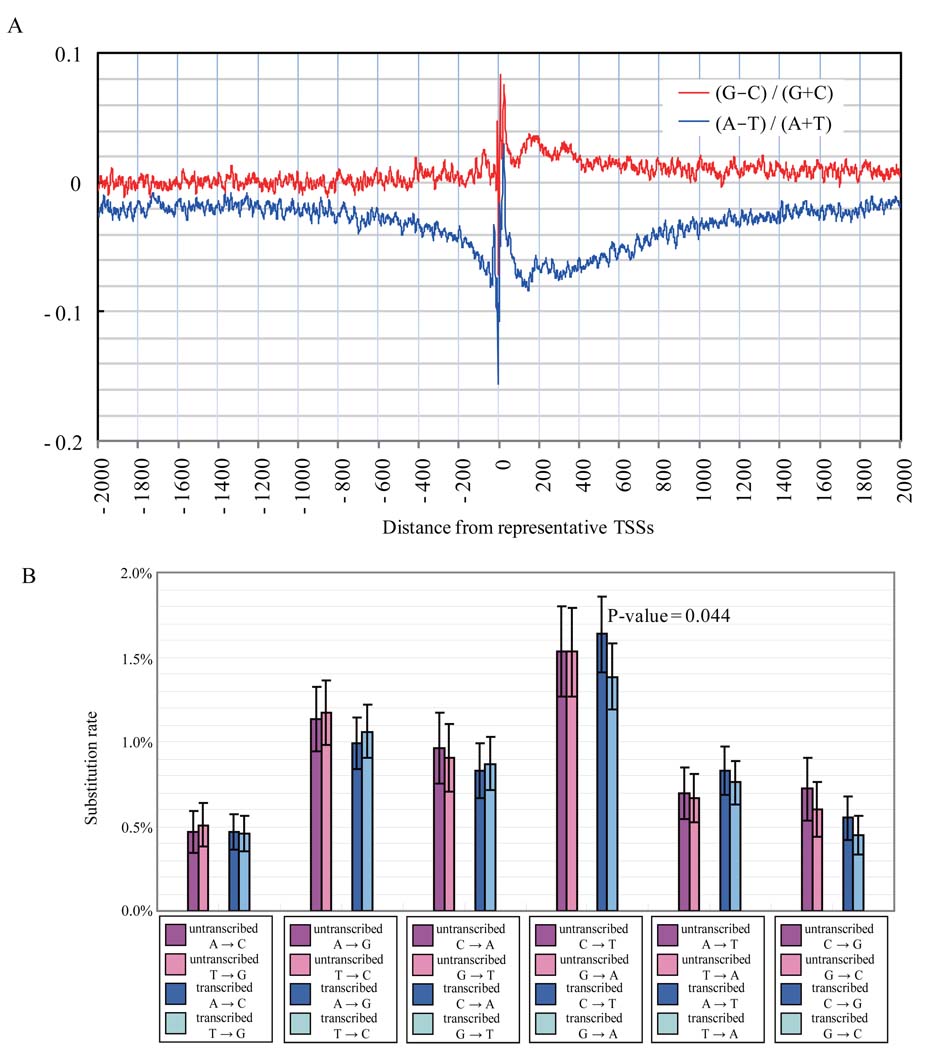
Might DNA sequence variation reflect germline genetic activity and underlying chromatin structure? We investigated this question using medaka (Japanese killifish, Oryzias latipes), by comparing the genomic sequences of two strains (Hd-rR and HNI) and by mapping approximately 37.3 million nucleosome cores from Hd-rR blastulae and 11,654 representative transcription start sites from six embryonic stages. We observed a distinctive approximately 200-base pair (bp) periodic pattern of genetic variation downstream of transcription start sites; the rate of insertions and deletions longer than 1 bp peaked at positions of approximately +200, +400, and +600 bp, whereas the point mutation rate showed corresponding valleys. This approximately 200-bp periodicity was correlated with the chromatin structure, with nucleosome occupancy minimized at positions 0, +200, +400, and +600 bp. These data exemplify the potential for genetic activity (transcription) and chromatin structure to contribute to molding the DNA sequence on an evolutionary time scale.


Figures

Figure 1
Figure 1
Diversity rates and nucleosome positions around TSSs. A. The x-axis shows the distance from the representative TSSs in the medaka (Hd-rR) genome. Blue line: mismatch mutation rate; light blue line: transition rate; light green line: transversion rate; red line: indel mutation rate; gray line: rate of indels of length 1bp. For smoothing of lines, a running average over a 23-bp window (one full turn of the helix in each direction) is depicted. B. The upper portion illustrates putative nucleosome dyads (red points, 73bp from start of sequence read) and cores (grey bars; 147bp). The lower table illustrates the distinct meanings of the three nucleosome indicators. C. Distribution of nucleosomes, substitutions, and indels surrounding a TSS. Black boxes: exons of the gene; blue histograms: distributions of the three nucleosome indicators; green vertical bars: substitutions between the Hd-rR and HNI genomes; red bars: deletions from the Hd-rR genome; blue bars: insertions into the Hd-rR genome; gray bars and boxes: failure of alignment. D. The green line presents the average local dyad positioning score.
Figure 2
Figure 2
Mutational spectra at positions around 8,181 positioned dyads that are isolated from their neighboring dyads by >165bp and are covered by an average of 5.44 putative nucleosome cores on a genome-wide scale (excluding TSSs and coding regions). A. In non-promoter regions where transcription does not occur, the two locations in the distinct strands are positionally equivalent in a nucleosome core if they are the same distance from the dyad. The x-axis presents the distance. Blue line: substitution rate; light blue line: transition rate; light green line: transversion rate; orange line: indel rate; yellow line: rate of 1bp indels. B. An expanded view of the indel rates enclosed in the green square in Fig. 2A is duplicated in tandem, and the two copies are overlaid for comparison with equivalent measurements relative to TSSs in Fig. 1A.The bottom panel presents the estimated dyads (arrows) aligned with dyad positioning score near TSSs (expanded from Fig. 1D).
Figure 3
Figure 3
A. Base composition surrounding transcription start sites (TSSs). Red line: the difference between guanines and cytosines; blue line: the difference between adenines and thymines. B. Substitution ratio around TSSs. Rates for each substitution and its complement and their 95% confidence intervals are indicated side by side for untranscribed and transcribed regions that are upstream and downstream of TSSs, respectively.

Comment in

Similar articles

Cited by

References

    1. Tijsterman M, de Pril R, Tasseron-de Jong J, Brouwer J. Mol Cell Biol. 1999;19:934. - PMC - PubMed
    1. Svejstrup J. Nat. Rev. Mol. Cell Biol. 2002;3:21. - PubMed
    1. Wellinger R, Thoma F. Embo J. 1997;16:5046. - PMC - PubMed
    1. Suter B, Livingstone-Zatchej M, Thoma F. Embo J. 1997;16:2150. - PMC - PubMed
    1. Higasa K, Hayashi K. BMC Genomics. 2006;7:66. - PMC - PubMed

Publication types

MeSH terms