. 2009 Feb 6;284(6):3793-803.
doi: 10.1074/jbc.M808920200. Epub 2008 Dec 12.

Alzheimer disease Abeta production in the absence of S-palmitoylation-dependent targeting of BACE1 to lipid rafts

Affiliations

Alzheimer disease Abeta production in the absence of S-palmitoylation-dependent targeting of BACE1 to lipid rafts

Kulandaivelu S Vetrivel et al. J Biol Chem. .

Abstract

Alzheimer disease beta-amyloid (Abeta) peptides are generated via sequential proteolysis of amyloid precursor protein (APP) by BACE1 and gamma-secretase. A subset of BACE1 localizes to cholesterol-rich membrane microdomains, termed lipid rafts. BACE1 processing in raft microdomains of cultured cells and neurons was characterized in previous studies by disrupting the integrity of lipid rafts by cholesterol depletion. These studies found either inhibition or elevation of Abeta production depending on the extent of cholesterol depletion, generating controversy. The intricate interplay between cholesterol levels, APP trafficking, and BACE1 processing is not clearly understood because cholesterol depletion has pleiotropic effects on Golgi morphology, vesicular trafficking, and membrane bulk fluidity. In this study, we used an alternate strategy to explore the function of BACE1 in membrane microdomains without altering the cellular cholesterol level. We demonstrate that BACE1 undergoes S-palmitoylation at four Cys residues at the junction of transmembrane and cytosolic domains, and Ala substitution at these four residues is sufficient to displace BACE1 from lipid rafts. Analysis of wild type and mutant BACE1 expressed in BACE1 null fibroblasts and neuroblastoma cells revealed that S-palmitoylation neither contributes to protein stability nor subcellular localization of BACE1. Surprisingly, non-raft localization of palmitoylation-deficient BACE1 did not have discernible influence on BACE1 processing of APP or secretion of Abeta. These results indicate that post-translational S-palmitoylation of BACE1 is not required for APP processing, and that BACE1 can efficiently cleave APP in both raft and non-raft microdomains.


Figures

FIGURE 1.
FIGURE 1.
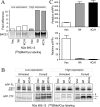
S-Palmitoylation of BACE1. A, the structure of BACE1. The predicted transmembrane domain is shaded and S-palmitoylated Cys residues are marked in wtBACE1. 3C/A and 4C/A represent BACE1 with 3 or 4 Ala substitutions. B, stable pools of BACE1-/- MEF or N2a cells harboring empty vector or indicated BACE1 cDNA were labeled with [3H]palmitic acid for 4 h and cell lysates were analyzed by immunoprecipitation with FLAG mAb. After exposure to PhosphorImager screens, the membranes were immunoblotted with FLAG mAb. C, N2a cells stably expressing wtBACE1 and 4C/A cells were pulse-labeled with [35S]Met/Cys for 30 min, and chased for the indicated period of time in the presence of cycloheximide. BACE1 was immunoprecipitated from lysates at each time point and analyzed by SDS-PAGE and phosphorimaging. D, COS7 cells were cotransfected with wtBACE1 and each of the DHHC PATs and labeled with [3H]palmitic acid. BACE1 was then immunoprecipitated from cell lysates and analyzed by phosphorimaging (top panel) or immunoblotting (middle panel). The expression of DHHC PATs in the corresponding samples is shown in the lower panel. The normalized ratio of [3H]palmitic acid to immunoblot signal is indicated as DHHC-induced fold-change in the efficiency of BACE1 palmitoylation. DHHC3, 4, 7, 15, and 20 significantly increased immature BACE1 palmitoylation.
FIGURE 2.
FIGURE 2.
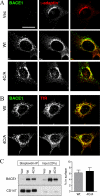
S-Palmitoylation of BACE1 does not affect the subcellular distribution of BACE1. A and B, confocal microscopy analysis of subcellular localization of BACE1. BACE1-/- MEF pools stably expressing wtBACE1 or BACE1-4C/A were co-stained with anti-BACE1 7523 antibody and the TGN marker γ-adaptin (panel A) or the recycling endosome marker transferrin receptor (TfR) (panel B). Note the absence of BACE1 staining in the vector-transfected BACE1-/- MEF. Scale bar represents 10 μm. C, analysis of cell surface BACE1. Subconfluent dishes of cells were surface biotinylated and the levels of cell surface BACE1 were examined by streptavidin capture of biotinylated proteins followed by immunoblotting. The blots were reprobed with antibodies against CD147, a cell surface protein. Values represent mean ± S.E. of three experiments.
FIGURE 3.
FIGURE 3.
S-Palmitoylation of BACE1 is required for DRM association. A and B, sucrose density gradient fractionation of stable BACE1-/- MEF or N2a cells. Cells were solubilized in 0.5% Lubrol WX and subject to sucrose gradient fractionation. The gradients were harvested from the top, and the distribution of BACE1 was determined by Western blot analysis. Fractions containing lipid raft-associated proteins were identified by the presence of raft marker flotillin-2. Fractions 1–3 were excluded because there were no detectable signals for any of the proteins tested. In the case of N2a cells (panel B), raft (4 and 5) and non-raft (8–12) fractions were pooled and analyzed by Western blotting. The gels were loaded with 10% of pooled raft fractions and 4% of non-raft fractions. Signal intensities from Western blots were quantified as described under “Experimental Procedures” and plotted. Values represent mean ± S.E. of three experiments. C, raft association of BACE1 at the cell surface. Subconfluent dishes of N2a cells were surface biotinylated and then fractionated using sucrose gradient fractionation. Biotinylated proteins were isolated from pooled raft and non-raft fractions using streptavidin beads and analyzed by immunoblotting. Because of the differences in relative abundance, the gels were loaded with 100 (raft) or 40% (non-raft) of material bound to streptavidin-agarose, and 10 (raft) or 4% (non-raft) of input lysate. D, signal intensities of immunoblots were quantified and plotted.
FIGURE 4.
FIGURE 4.
Analysis of wtAPP metabolism. A, quantitative analysis of BACE1 expression in low and high expressor pools. Stable pools of N2a 6951.3 cells were metabolically labeled with [35S]Met/Cys for 3 h and BACE1 was immunoprecipitated from the cell lysate with anti-BACE1 antibody and analyzed by phosphorimaging. B, metabolic analysis of APP CTFs. Subconfluent dishes of N2a 6951.3 pools were treated with Me2SO (vehicle) or Compound E (10 nm) for 16 h and metabolically labeled with [35S]Met/Cys for 3 h in the presence of Me2SO or Compound E. APP FL and APP CTFs were immunoprecipitated from equal amounts of total protein lysates with CTM1 antibody and analyzed by phosphorimaging. C, ELISA quantification of sAPPα and sAPPβ levels from medium conditioned by N2a 695.13 cells stably overexpressing wtBACE1 and 4C/A mutant. Values represent mean ± S.E. of three experiments.
FIGURE 5.
FIGURE 5.
Analysis of APPSwe metabolism. Subconfluent dishes of N2a Swe.10 (A) or BACE1-/- APPSwe MEF (B) were lysed and equal amounts of total proteins were analyzed by Western blotting with antibodies against BACE1 and APP. APP FL and APP CTFs were detected by antibody CTM1 (raised against the C terminus of APP) and β-CTF were selectively detected using mAb 26D6 (epitope 1–12 of Aβ).
FIGURE 6.
FIGURE 6.
DRM association of APP CTFs. A, N2a 695.13 pools stably expressing wtBACE1 or BACE1-4C/A were treated with Compound E (10 nm) for 16 h and then lipid rafts were isolated by sucrose gradient fractionation. Raft and non-raft distribution of APP CTF was analyzed by Western blotting and the same blot was sequentially probed with antibodies against BACE1, PS1 N-terminal fragment, and flotillin-2. B, signal intensities of APP CTFs were quantified and plotted. Values represent mean ± S.E. of three experiments.
FIGURE 7.
FIGURE 7.
Quantitative analysis of Aβ secretion. A, N2a 695.13 pools stably expressing wtBACE1 or BACE1-4C/A were metabolically labeled with [35S]Met/Cys for 15 min or 3 h. Lysates of cells labeled for 15 min were analyzed by immunoprecipitating with CTM1 to determine APP synthesis. Secreted Aβ was analyzed by immunoprecipitation of conditioned media from cells labeled for 3 h. B–D, ELISA quantification of conditioned media of stable N2a 695.13 pools was performed using mAb B113 capture/B436 detection (Aβ1–40); mAb B436 capture/4G8 detection (Aβ1-x); or mAb B113 capture/4G8 detection (Aβx-40). Values represent mean ± S.E. of three experiments.

Similar articles

Cited by

References

    1. Vassar, R., Bennett, B. D., Babu-Khan, S., Kahn, S., Mendiaz, E. A., Denis, P., Teplow, D. B., Ross, S., Amarante, P., Loeloff, R., Luo, Y., Fisher, S., Fuller, J., Edenson, S., Lile, J., Jarosinski, M. A., Biere, A. L., Curran, E., Burgess, T., Louis, J. C., Collins, F., Treanor, J., Rogers, G., and Citron, M. (1999) Science 286 735-741 - PubMed
    1. Sinha, S., Anderson, J. P., Barbour, R., Basi, G. S., Caccavello, R., Davis, D., Doan, M., Dovey, H. F., Frigon, N., Hong, J., Jacobson-Croak, K., Jewett, N., Keim, P., Knops, J., Lieberburg, I., Power, M., Tan, H., Tatsuno, G., Tung, J., Schenk, D., Seubert, P., Suomensaari, S. M., Wang, S., Walker, D., Zhao, J., McConlogue, L., and John, V. (1999) Nature 402 537-540 - PubMed
    1. Yan, R., Bienkowski, M. J., Shuck, M. E., Miao, H., Tory, M. C., Pauley, A. M., Brashier, J. R., Stratman, N. C., Mathews, W. R., Buhl, A. E., Carter, D. B., Tomasselli, A. G., Parodi, L. A., Heinrikson, R. L., and Gurney, M. E. (1999) Nature 402 533-537 - PubMed
    1. Cai, H., Wang, Y., McCarthy, D., Wen, H., Borchelt, D. R., Price, D. L., and Wong, P. C. (2001) Nat. Neurosci. 4 233-234 - PubMed
    1. Cole, S. L., and Vassar, R. (2008) J. Biol. Chem. 283 29621-29625 - PMC - PubMed

Publication types

MeSH terms