

Auditory oddball deficits in schizophrenia: an independent component analysis of the fMRI multisite function BIRN study
- PMID: 19074498
- PMCID: PMC2643962
- DOI: 10.1093/schbul/sbn133
Auditory oddball deficits in schizophrenia: an independent component analysis of the fMRI multisite function BIRN study
Abstract
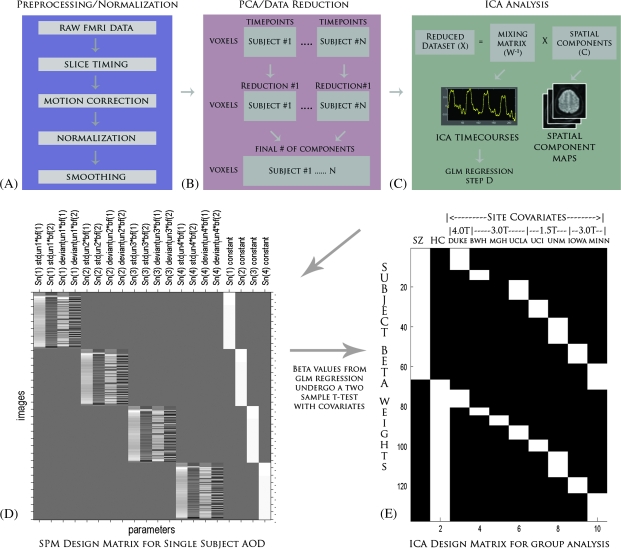
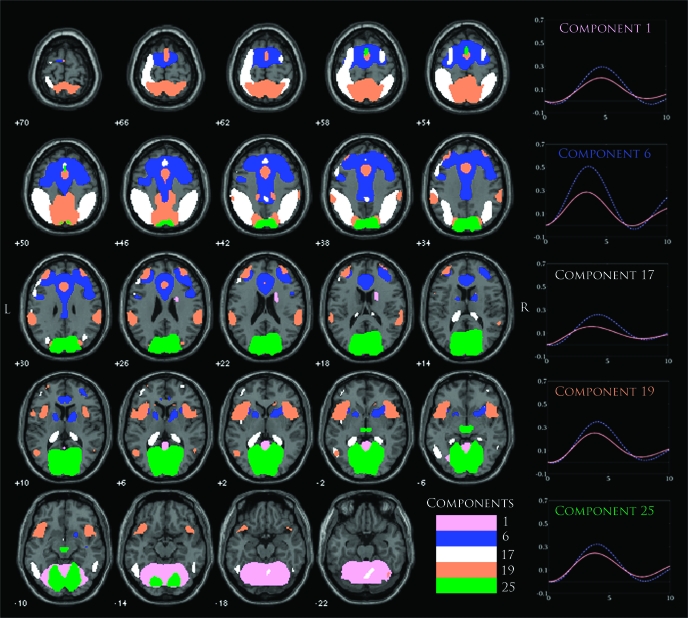
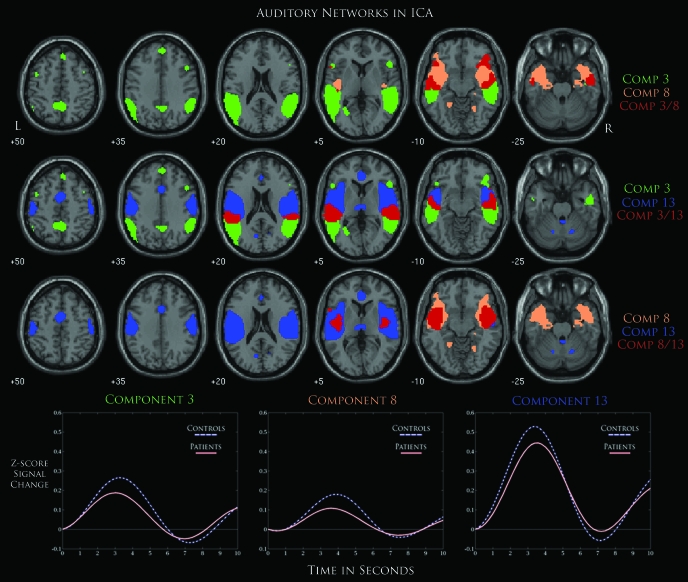
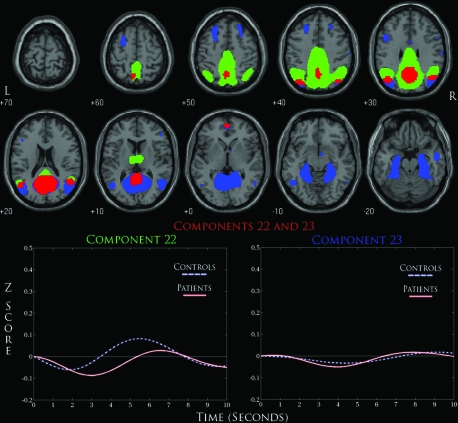
Deficits in the connectivity between brain regions have been suggested to play a major role in the pathophysiology of schizophrenia. A functional magnetic resonance imaging (fMRI) analysis of schizophrenia was implemented using independent component analysis (ICA) to identify multiple temporally cohesive, spatially distributed regions of brain activity that represent functionally connected networks. We hypothesized that functional connectivity differences would be seen in auditory networks comprised of regions such as superior temporal gyrus as well as executive networks that consisted of frontal-parietal areas. Eight networks were found to be implicated in schizophrenia during the auditory oddball paradigm. These included a bilateral temporal network containing the superior and middle temporal gyrus; a default-mode network comprised of the posterior cingulate, precuneus, and middle frontal gyrus; and multiple dorsal lateral prefrontal cortex networks that constituted various levels of between-group differences. Highly task-related sensory networks were also found. These results indicate that patients with schizophrenia show functional connectivity differences in networks related to auditory processing, executive control, and baseline functional activity. Overall, these findings support the idea that the cognitive deficits associated with schizophrenia are widespread and that a functional connectivity approach can help elucidate the neural correlates of this disorder.
Figures

References
-
- Jeon YW, Polich J. Meta-analysis of P300 and schizophrenia: patients, paradigms, and practical implications. Psychophysiology. 2003;40:684–701. - PubMed
-
- Halgren E, Marinkovic K, Chauvel P. Generators of the late cognitive potentials in auditory and visual oddball tasks. Electroencephalogr Clin Neurophysiol. 1998;106:156–164. - PubMed
-
- McCarthy G, Wood CC. Intracranial recordings of endogenous ERPs in humans. Electroencephalogr Clin Neurophysiol Suppl. 1987;39:331–337. - PubMed
-
- Ross CA, Margolis RL, Reading SA, Pletnikov M, Coyle JT. Neurobiology of schizophrenia. Neuron. 2006;52:139–153. - PubMed
-
- Friston KJ. The disconnection hypothesis. Schizophr Res. 1998;30:115–125. - PubMed
Publication types
MeSH terms
Grants and funding
LinkOut - more resources
Full Text Sources
Medical
Miscellaneous
