

CNTRICS final task selection: control of attention
- PMID: 19074499
- PMCID: PMC2617743
- DOI: 10.1093/schbul/sbn158
CNTRICS final task selection: control of attention
Abstract
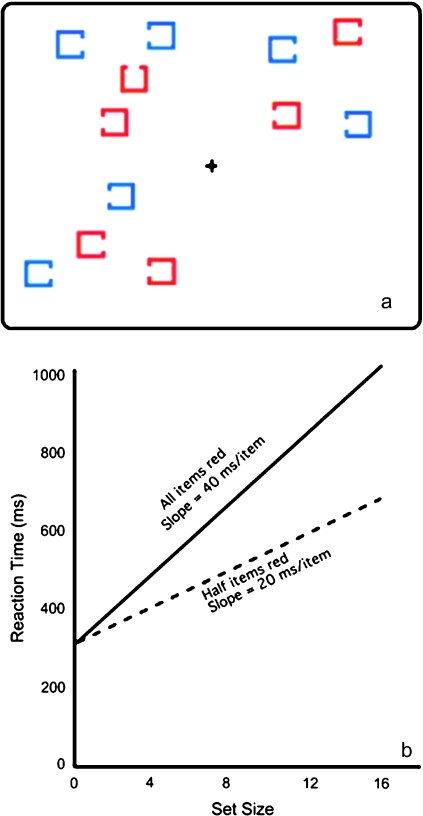
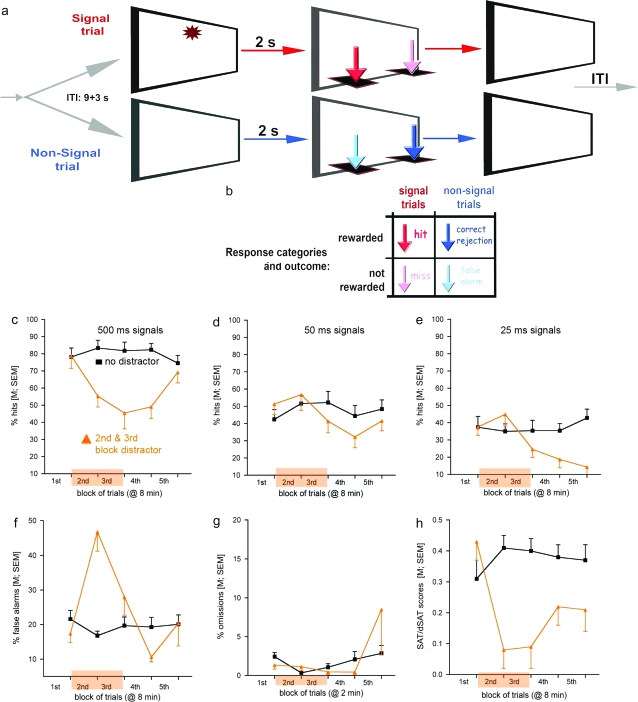
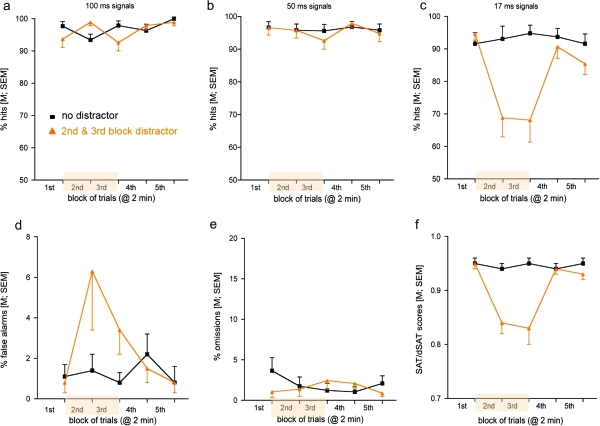
The construct of attention has many facets that have been examined in human and animal research and in healthy and psychiatrically disordered conditions. The Cognitive Neuroscience Treatment Research to Improve Cognition in Schizophrenia (CNTRICS) group concluded that control of attention-the processes that guide selection of task-relevant inputs-is particularly impaired in schizophrenia and could profit from further work with refined measurement tools. Thus, nominations for cognitive tasks that provide discrete measures of control of attention were sought and were then evaluated at the third CNTRICS meeting for their promise for future use in treatment development. This article describes the 5 nominated measures and their strengths and weaknesses for cognitive neuroscience work relevant to treatment development. Two paradigms, Guided Search and the Distractor Condition Sustained Attention Task, were viewed as having the greatest immediate promise for development into tools for treatment research in schizophrenia and are described in more detail by their nominators.
Figures
References
-
- Bleuler E. Dementia Praecox or the Group of Schizophrenias. New York, NY: International Universities Press; 1950.
-
- Kraepelin E. Dementia Praecox and Paraphrenia. Edinburgh, UK: E. & S. Livingston; 1919.
-
- Braff D. Information processing and attention dysfunctions in schizophrenia. Schizophr Bull. 1993;19:233–259. - PubMed
-
- Nuechterlein KH, Dawson ME. Information processing and attentional functioning in the developmental course of schizophrenic disorders. Schizophr Bull. 1984;10:160–203. - PubMed
-
- Cornblatt BA, Keilp JG. Impaired attention, genetics, and the pathophysiology of schizophrenia. Schizophr Bull. 1994;20:31–46. - PubMed
Publication types
MeSH terms
Grants and funding
- MH037705/MH/NIMH NIH HHS/United States
- R01 MH080332/MH/NIMH NIH HHS/United States
- MH065034/MH/NIMH NIH HHS/United States
- MH068580/MH/NIMH NIH HHS/United States
- R01 MH037705/MH/NIMH NIH HHS/United States
- P30 MH068580/MH/NIMH NIH HHS/United States
- K02 MH001072/MH/NIMH NIH HHS/United States
- P50 MH066286/MH/NIMH NIH HHS/United States
- R21 MH080426/MH/NIMH NIH HHS/United States
- MH080426/MH/NIMH NIH HHS/United States
- MH066286/MH/NIMH NIH HHS/United States
- MH080332/MH/NIMH NIH HHS/United States
- K02 MH01072/MH/NIMH NIH HHS/United States
- R01 MH065034/MH/NIMH NIH HHS/United States
LinkOut - more resources
Full Text Sources
Medical
