

High-level expression of the T-cell chemokines CCL3 and CCL4 by chronic lymphocytic leukemia B cells in nurselike cell cocultures and after BCR stimulation
- PMID: 19074730
- PMCID: PMC4916945
- DOI: 10.1182/blood-2008-07-170415
High-level expression of the T-cell chemokines CCL3 and CCL4 by chronic lymphocytic leukemia B cells in nurselike cell cocultures and after BCR stimulation
Abstract
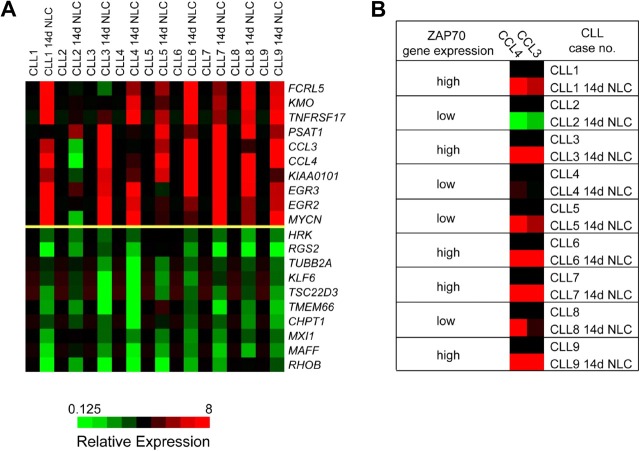
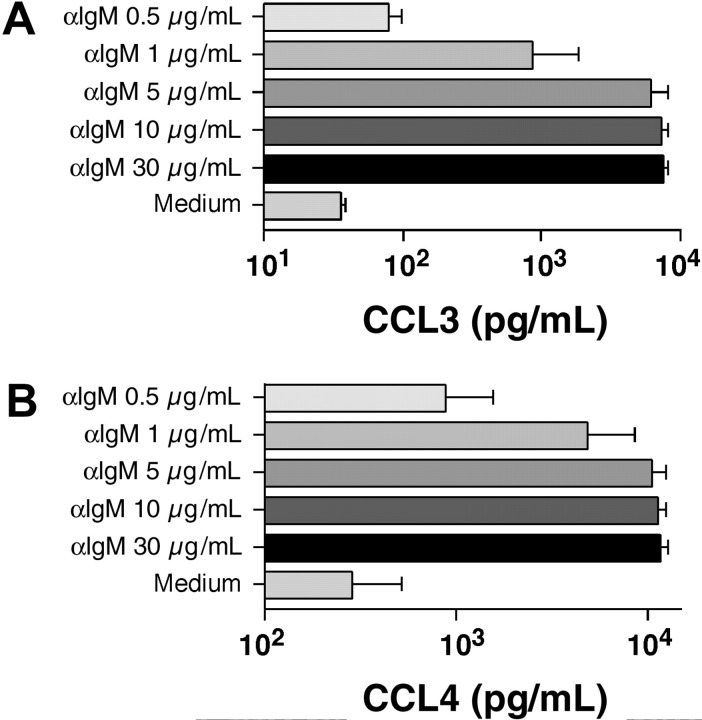
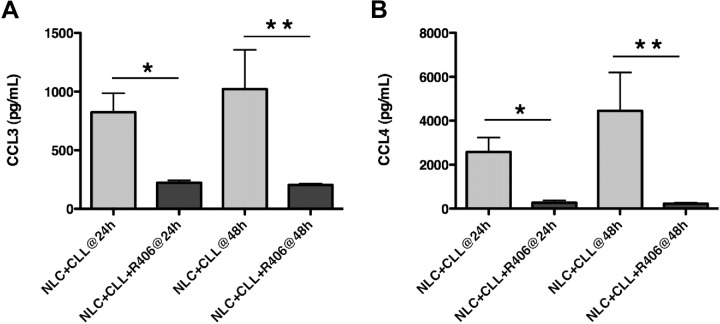
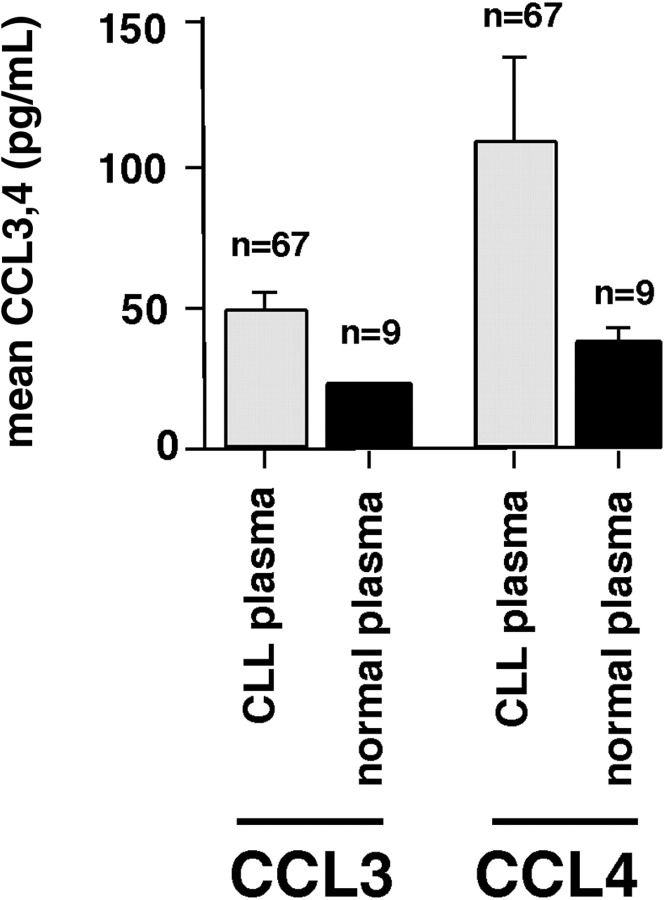
In lymphatic tissues, chronic lymphocytic leukemia (CLL) cells are interspersed with CD68(+) nurselike cells (NLCs), T cells, and other stromal cells that constitute the leukemia microenvironment. However, the mechanism regulating colocalization of CLL and these accessory cells are largely unknown. To dissect the molecular cross talk between CLL and NLCs, we profiled the gene expression of CD19-purified CLL cells before and after coculture with NLCs. NLC coculture induced high-level expression of B-cell maturation antigen and 2 chemoattractants (CCL3, CCL4) by CLL cells. CCL3/CCL4 induction in NLC cocultures correlated with ZAP-70 expression by CLL cells. High CCL3/CCL4 protein levels were found in CLL cocultures with NLCs, and CCL3/CCL4 induction was abrogated by R406, a Syk inhibitor, suggesting that NLCs induce these chemokines via B-cell receptor (BCR) activation. BCR triggering also caused robust CCL3/CCL4 protein secretion by CLL cells. High CCL3 and CCL4 plasma levels in CLL patients suggest that this pathway plays a role in vivo. These studies reveal a novel mechanism of cross talk between CLL cells and their microenvironment, namely, the secretion of 2 T-cell chemokines in response to NLC coculture and BCR stimulation. Through these chemokines, CLL cells can recruit accessory cells and thereby actively create a supportive microenvironment.
Figures
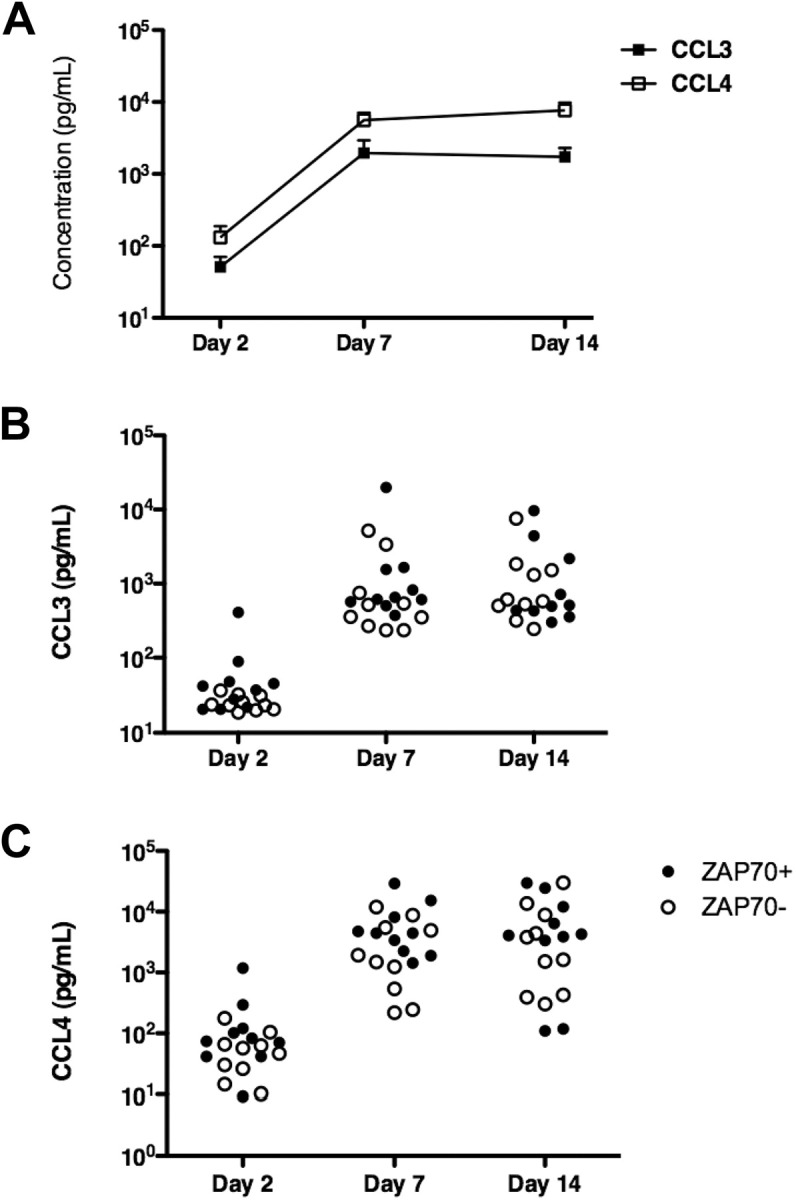
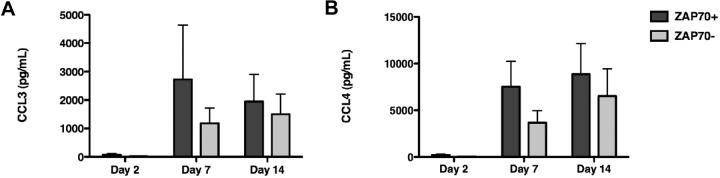
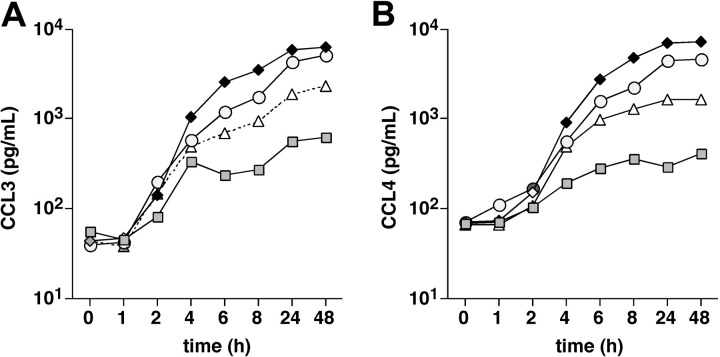
 , n = 10) or ZAP-70− CLL samples (
 , n = 10). In ZAP-70+ CLL samples, we found higher levels of both CCL3 and CCL4 at all time points. However, these differences did not reach statistical significance.
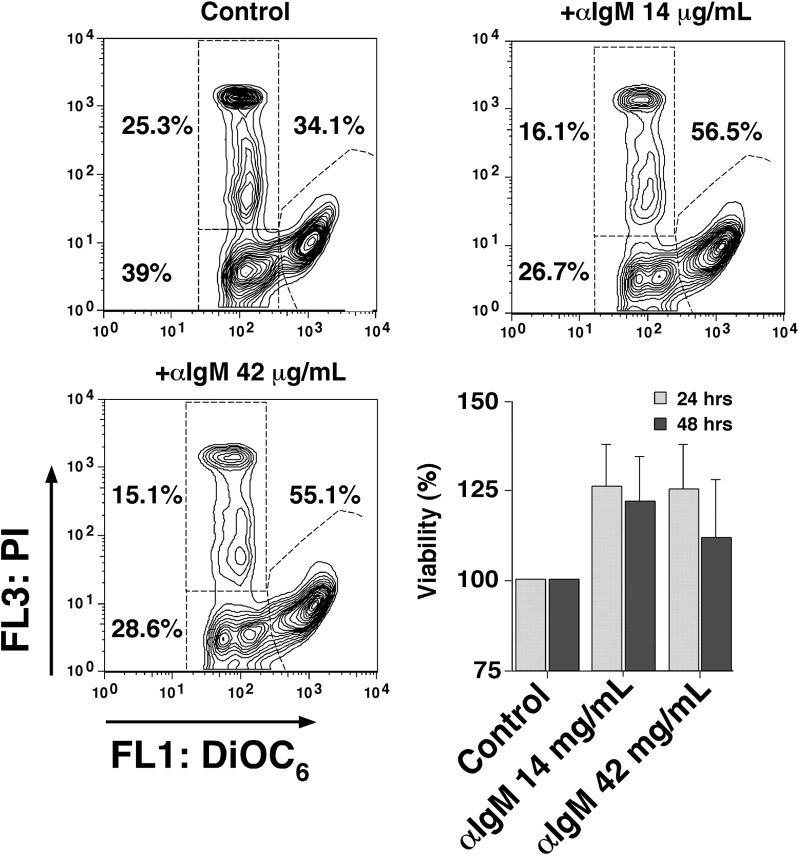
References
-
- Chiorazzi N, Rai KR, Ferrarini M. Chronic lymphocytic leukemia. N Engl J Med. 2005;352:804–815. - PubMed
-
- Munk Pedersen I, Reed J. Microenvironmental interactions and survival of CLL B-cells. Leuk Lymphoma. 2004;45:2365–2372. - PubMed
-
- Burger JA, Tsukada N, Burger M, Zvaifler NJ, Dell'Aquila M, Kipps TJ. Blood-derived nurse-like cells protect chronic lymphocytic leukemia B cells from spontaneous apoptosis through stromal cell-derived factor-1. Blood. 2000;96:2655–2663. - PubMed
-
- Tsukada N, Burger JA, Zvaifler NJ, Kipps TJ. Distinctive features of “nurselike” cells that differentiate in the context of chronic lymphocytic leukemia. Blood. 2002;99:1030–1037. - PubMed
-
- Deaglio S, Vaisitti T, Bergui L, et al. CD38 and CD100 lead a network of surface receptors relaying positive signals for B-CLL growth and survival. Blood. 2005;105:3042–3050. - PubMed
Publication types
MeSH terms
Substances
LinkOut - more resources
Full Text Sources
Other Literature Sources
Molecular Biology Databases
Research Materials
Miscellaneous
