. 2009 Feb 13;284(7):4052-61.
doi: 10.1074/jbc.M805032200. Epub 2008 Dec 13.

Protein kinase C-delta and phosphatidylinositol 3-kinase/Akt activate mammalian target of rapamycin to modulate NF-kappaB activation and intercellular adhesion molecule-1 (ICAM-1) expression in endothelial cells

Affiliations

Protein kinase C-delta and phosphatidylinositol 3-kinase/Akt activate mammalian target of rapamycin to modulate NF-kappaB activation and intercellular adhesion molecule-1 (ICAM-1) expression in endothelial cells

Mohd Minhajuddin et al. J Biol Chem. .

Abstract

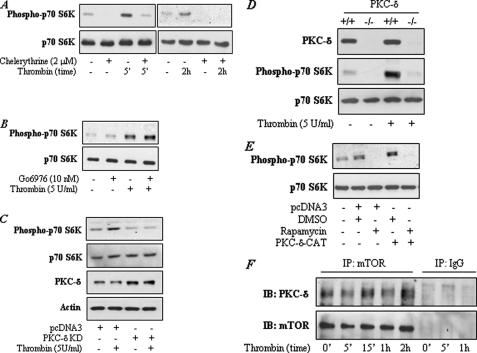
We have shown that the mammalian target of rapamycin (mTOR) down-regulates thrombin-induced ICAM-1 expression in endothelial cells by suppressing the activation of NF-kappaB. However, the mechanisms by which mTOR is activated to modulate these responses remain to be addressed. Here, we show that thrombin engages protein kinase C (PKC)-delta and phosphattidylinositol 3-kinase (PI3K)/Akt pathways to activate mTOR and thereby dampens NF-kappaB activation and intercellular adhesion molecule 1 (ICAM-1) expression. Stimulation of human vascular endothelial cells with thrombin induced the phosphorylation of mTOR and its downstream target p70 S6 kinase in a PKC-delta- and PI3K/Akt-dependent manner. Consistent with this, thrombin-induced phosphorylation of p70 S6 kinase was defective in embryonic fibroblasts from mice with targeted disruption of PKC-delta (Pkc-delta(-)(/)(-)), p85alpha and p85beta subunits of the PI3K (p85alpha(-)(/)(-)beta(-)(/)(-)), or Akt1 and Akt2 (Akt1(-)(/)(-)2(-)(/)(-)). Furthermore, we observed that expression of the constitutively active form of PKC-delta or Akt was sufficient to induce NF-kappaB activation and ICAM-1 expression, and that co-expression of mTOR suppressed these responses. In reciprocal experiments, inhibition/depletion of mTOR augmented NF-kappaB activation and ICAM-1 expression induced by PKC-delta or Akt. In control experiments, increasing or impairing mTOR signaling by the above approaches produced similar effects on NF-kappaB activation and ICAM-1 expression induced by thrombin. Thus, these data reveal an important role of PKC-delta and PI3K/Akt pathways in activating mTOR as an endogenous modulator to ensure a tight regulation of NF-kappaB signaling of ICAM-1 expression in endothelial cells.


Figures

FIGURE 1.
FIGURE 1.
A, thrombin induces biphasic phosphorylation of mTOR and p70 S6 kinase in endothelial cells. Confluent HUVEC monolayers were challenged with thrombin (5 units/ml) for the indicated time periods. Total cell lysates were separated by SDS-PAGE and immunoblotted with an anti-phospho-mTOR (Ser2248) or anti-phospho-p70 S6K (Thr421/Ser424) antibody. The blots were subsequently stripped and reprobed with an antibody to p70 S6K to monitor loading. The bar graph represents the level of mTOR and p70 S6K phosphorylation induced by thrombin at different time points. mTOR and p70 S6K phosphorylation normalized to total p70 S6K is expressed relative to the untreated control set at 1. Data are mean ± S.E. (n = 4 for each condition). *, p < 0.05 compared with untreated control. B and C, inhibition or depletion of mTOR prevents p70 S6 kinase phosphorylation in endothelial cells. HUVEC were (B) pretreated with rapamycin (5 ng/ml) for 45 min prior to challenge with thrombin (5 units/ml) for the indicated time periods or (C) transfected with siRNA targeting mTOR (siRNA-mTOR) or control siRNA (siRNA-Con) and then challenged with thrombin (5 units/ml) for 5 min. Total cell lysates were separated by SDS-PAGE, and immunoblotted with an (B and C) anti-phospho-p70 S6K (Thr421/Ser424) antibody or (C) anti-mTOR antibody. Total p70 S6 kinase levels were used to monitor loading. The bar graph represents the effect of rapamycin (A) or RNAi (B) knockdown of mTOR on p70 S6K phosphorylation. p70 S6K phosphorylation normalized to total p70 S6K is expressed relative to the untreated control set at 1. Data are mean ± S.E. (n = 3 for each condition). *, p < 0.05 compared with untreated control; Ψ, p < 0.05 compared with untreated control; #, p < 0.05 compared with thrombin-stimulated control.
FIGURE 2.
FIGURE 2.
A–C, inhibition of PKC-δ prevents thrombin-induced p70 S6 kinase phosphorylation in endothelial cells. HUVEC were pretreated with chelerythrine (2 μm) (A) or Go6976 (10 nm) (B) or transfected with pcDNA3-PKCδ-KD (C) encoding kinase-defective PKC-δ (PKCδ-KD) mutant or empty vector (pcDNA3) using Lipofectamine 2000 as described under “Experimental Procedures.” Cells were then challenged with thrombin (5 units/ml) for (A) the indicated time periods or (B and C) 5 min. Total cell lysates were separated by SDS-PAGE and immunoblotted with an anti-phospho p70 S6K (Thr421/Ser424). Total p70 S6K levels were used to monitor loading. Lysates in C were also immunoblotted with an anti-PKC-δ or anti-β-actin antibody. Results are representative of two to three separate experiments. D, loss of PKC-δ impairs thrombin-induced p70 S6 kinase phosphorylation in mouse embryonic fibroblasts. Pkcδ+/+ and Pkcδ–/– immortalized MEFs were challenged with thrombin for 5 min. Total cell lysates were separated by SDS-PAGE, and immunoblotted with an anti-PKC-δ or anti-phospho-p70 S6K (Thr421/Ser424) antibody. Total p70 S6K levels were used to monitor loading. Results are representative of two separate experiments. E, activation of PKC-δ is sufficient to induce p70 S6 kinase phosphorylation in endothelial cells. HUVEC were transfected with the construct pcDNA3-PKCδ-CAT encoding constitutively active PKC-δ (PKCδ-CAT) mutant or empty vector (pcDNA3) using Lipofectamine 2000 as described under “Experimental Procedures.” Cells were incubated with rapamycin (5 ng/ml) or dimethyl sulfoxide (vehicle) alone for 6–8 h. Total cell lysates were separated by SDS-PAGE, and immunoblotted with an anti-phospho-p70 S6K antibody. Total p70 S6K levels were used to monitor loading. Results are representative of two separate experiments. F, PKC-δ is constitutively associated with mTOR in endothelial cells. HUVEC were challenged with thrombin (5 units/ml) for the indicated times. Total cell lysates were immunoprecipitated with an antibody to mTOR or IgG. The immunoprecipitates were then immunoblotted with an anti-PKC-δ and mTOR antibody. Results are representative of three separate experiments.
FIGURE 3.
FIGURE 3.
AC, inhibition of PI3K impairs thrombin-induced p70 S6 kinase phosphorylation. Confluent (A) HUVEC or (B) HLMVEC monolayers were pretreated with LY294002 (50 μm) prior to challenge with thrombin (5 units/ml) for the indicated time periods. C, confluent HUVEC monolayers were pretreated with wortmannin (50 nm) prior to challenge with thrombin (5 units/ml) for the indicated time periods. Total cell lysates were immunoblotted with an anti-phospho-p70 S6K (Thr421/Ser424) antibody. Total p70 S6K levels were used to monitor loading. The bar graph represents the effect of wortmannin on thrombin-induced p70 S6K phosphorylation. p70 S6K phosphorylation normalized to total p70 S6K is expressed relative to the untreated control set at 1. Data are mean ± S.E. (n = 3 for each condition). *, p < 0.05 compared with untreated control; #, p < 0.05 compared with thrombin-stimulated control. D, loss of PI3K prevents thrombin-induced p70 S6 kinase phosphorylation. p85α+/++/+ and p85α–/––/– MEFs were challenged with thrombin (5 units/ml) for 5 min. Total cell lysates were immunoblotted with an anti-phospho-p70 S6K (Thr421/Ser424) antibody. Total p70 S6K levels were used to monitor loading. Results are representative of two to three separate experiments.
FIGURE 4.
FIGURE 4.
A–C: A and B, inhibition of PI3K prevents thrombin-induced Akt phosphorylation. HUVEC were (A) challenged with thrombin (5 units/ml) for the indicated time periods or (B) pretreated with LY294002 (50 μm) prior to challenge with thrombin (5 units/ml) for 5 min. Total cell lysates were separated with SDS-PAGE and immunoblotted with an anti-phospho-Akt (Ser473) antibody. Total Akt levels were used to monitor loading. The bar graphs represent (A) the time course of Akt phosphorylation induced by thrombin and (B) the effect of LY294002 on thrombin-induced Akt phosphorylation. Akt phosphorylation normalized to total Akt is expressed relative to the untreated control set at 1. Data are mean ± S.E. (n = 3 for each condition). *, p < 0.05 compared with untreated control; #, p < 0.05 compared with thrombin-stimulated control. C, loss of PI3K prevents thrombin-induced Akt phosphorylation. p85α+/+β+/+ and p85α–/–β–/– MEFs were challenged with thrombin (5 units/ml) for 5 min. Total cell lysates were separated with SDS-PAGE and immunoblotted with an anti-phospho-Akt (Ser473) antibody. Total Akt or actin levels were used to monitor loading. Results are representative of two to three separate experiments. D, loss of Akt1 and Akt2 subunits prevents thrombin-induced p70 S6 kinase phosphorylation. Akt1+/+2+/+ and Akt1/2/ MEFs were challenged with thrombin (5 units/ml) for 5 min. Total cell lysates were immunoblotted with an anti-Akt or anti-phospho-p70 S6K antibody. Total p70 S6K levels were used to monitor loading. Results are representative of three separate experiments.
FIGURE 5.
FIGURE 5.
Overexpression of mTOR suppresses PKC-δ- and Akt-induced NF-κB activity in endothelial cells. A, HUVEC were transfected with NF-κBLUC in combination with pcDNA3-PKCδ-CAT encoding constitutively active PKC-δ (PKC-δ-CAT) and pRK5-mTOR-WT encoding wild type mTOR (mTOR-WT) using DEAE-dextran as described under “Experimental Procedures.” B, HUVEC were transfected with NF-κB LUC in combination with pcDNA3-Akt-CAT encoding constitutively active Akt (Akt-CAT) and pRK5-mTOR-WT using Lipofectamine 2000 as described under “Experimental Procedures.” After 18 h, cell extracts were prepared and assayed for firefly and Renilla luciferase activities. Data are mean ± S.E. (n = 6 to 9 for each condition). *, p < 0.05 compared with vector-transfected control; #, p < 0.01 compared with PKCδ-CAT- or Akt-CAT-transfected control.
FIGURE 6.
FIGURE 6.
Overexpression of mTOR suppresses PKC-δ- and Akt-induced ICAM-1 expression in endothelial cells. A, HUVEC were transfected with pcDNA3-PKCδ-CAT, pcDNA3-Akt-CAT, or pRK5-mTOR-WT using Lipofectamine 2000 as described under “Experimental Procedures.” After 24 h, total cell lysates were prepared and analyzed by immunoblotting using an anti-PKC-δ, anti-HA, or anti-mTOR antibody to verify the expression of PKCδ-CAT, Akt-CAT, or mTOR, respectively. PKC-δ-CAT corresponds to ∼47 kDa as it contains only the catalytic domain and therefore can be distinguished from the endogenous PKC-δ (76 kDa). Anti-HA antibody allowed the detection of Akt-CAT but not the endogenous Akt. Increased expression of mTOR in mTOR-WT-transduced cells was due to overexpressed mTOR. Actin levels were used to monitor loading. B, HUVEC were transfected with pCDNA3-PKCδ-CAT in combination with pRK5-mTOR-WT using Lipofectamine 2000 as described under “Experimental Procedures.” Total cell lysates were resolved by SDS-PAGE and immunoblotted with an antibody to ICAM-1. Actin levels were used to monitor loading. Results are representative of two separate experiments. C, HUVEC were transfected with pCDNA3-Akt-CAT in combination with pRK5-mTOR-WT using Lipofectamine 2000 as described under “Experimental Procedures.” Total cell lysates were resolved by SDS-PAGE and immunoblotted with an antibody to ICAM-1. Actin levels were used to monitor loading. Results are representative of two separate experiments.
FIGURE 7.
FIGURE 7.
A and B, inhibition of mTOR augments PKC-δ- and Akt-induced NF-κB activity in endothelial cells. HUVEC were co-transfected with NF-κBLUC and pcDNA3-PKCδ-CAT (A) or NF-κBLUC and pcDNA3-Akt-CAT (B) using Lipofectamine 2000 as described under “Experimental Procedures.” Cells were treated with rapamycin (5 ng/ml) for 12–18 h, and the cell extracts were assayed for firefly and Renilla luciferase activities. Data are mean ± S.E. (n = 6 to 9 for each condition). *, p < 0.05 compared with vector (pcDNA3)-transfected control; #, p < 0.05 compared with PKC-δ-CAT- or Akt-CAT-transfected control. C and D, depletion of mTOR augments PKC-δ- and Akt-induced NF-κB activity in endothelial cells. C, HUVEC were transfected with NF-κBLUC in combination with pCDNA3-PKCδ-CAT and pCDNA3.1-mTOR shRNA encoding short hairpin RNA targeting mTOR (mTOR shRNA) using DEAE-dextran. D, HUVEC were transfected with NF-κBLUC in combination with pCDNA3-Akt-CAT and pCDNA3.1-mTOR shRNA using Lipofectamine 2000. After 18 h, cells extracts were prepared and assayed for firefly and Renilla luciferase activities. Data are mean ± S.E. (n = 6 to 8 for each condition). *, p < 0.05 compared with vector-transfected control; #, p < 0.05 compared with PKC-δ-CAT- or Akt-CAT-transfected control.
FIGURE 8.
FIGURE 8.
Inhibition or depletion of mTOR augments PKC-δ- and Akt-induced ICAM-1 expression in endothelial cells. HUVEC (A) or HLMVEC (B) were transfected with pCDNA3-PKCδ-CAT or empty vector (pCDNA3) using Lipofectamine 2000 as described under “Experimental Procedures.” Cells were incubated with rapamycin (5 ng/ml) or dimethyl sulfoxide (vehicle) alone for 6–8 h. Total cell lysates were resolved by SDS-PAGE and immunoblotted with an anti-ICAM-1 antibody. Actin levels were used to monitor loading. Results are representative of two separate experiments. C, HUVEC were co-transfected with pCDNA3-Akt-CAT and pCDNA3.1-mTOR shRNA using Lipofectamine 2000. Total cell lysates were resolved by SDS-PAGE and immunoblotted with an anti-ICAM-1 antibody. Actin levels were used to monitor loading (upper panel). The same lysates were re-electrophoresed and immunoblotted with an anti-mTOR antibody to assess the depletion of mTOR (lower panel). Results are representative of two separate experiments.

Similar articles

Cited by

References

    1. Springer, T. A. (1994) Cell 76 301–314 - PubMed
    1. Smith, C. W., Marlin, S. D., Rothlein, R., Toman, C., and Anderson, D. C. (1989) J. Clin. Investig. 83 2008–2017 - PMC - PubMed
    1. Doerschuk, C. M., Tasaka, S., and Wang, Q. (2000) Am. J. Respir. Cell Mol. Biol. 23 133–136 - PubMed
    1. Rahman, A., Anwar, K. N., True, A. L., and Malik, A. B. (1999) J. Immunol. 162 5466–5476 - PubMed
    1. Rahman, A., Anwar, K. N., Uddin, S., Xu, N., Ye, R. D., Platanias, L. C., and Malik, A. B. (2001) Mol. Cell. Biol. 21 5554–5565 - PMC - PubMed

Publication types

MeSH terms

LinkOut - more resources