. 2009 Apr;50(4):1940-7.
doi: 10.1167/iovs.08-2671. Epub 2008 Dec 13.

Sublethal photic stress and the motility of RPE phagosomes and melanosomes

Affiliations

Sublethal photic stress and the motility of RPE phagosomes and melanosomes

Janice M Burke et al. Invest Ophthalmol Vis Sci. 2009 Apr.

Abstract

Purpose: To determine whether sublethal oxidative stress to the retinal pigment epithelium by visible light treatment affects the translocation of organelles, notably phagosomes and melanosomes.

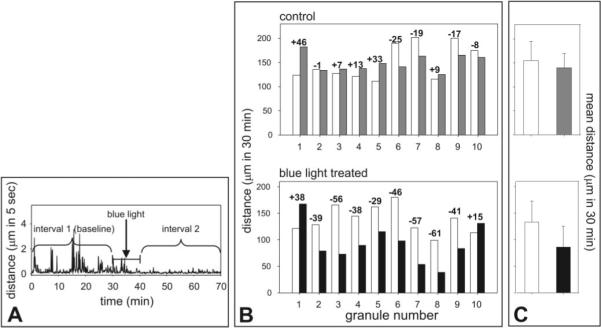
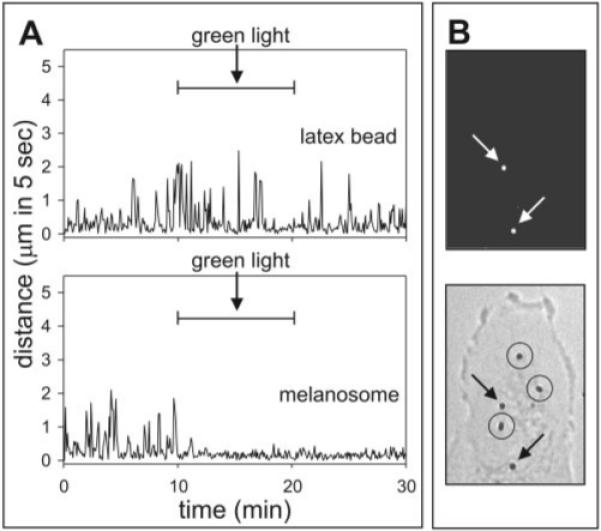
Methods: Isolated porcine melanosomes were phagocytized by ARPE-19 cells, then cultures were treated with blue light to generate reactive oxygen intermediates (ROIs) by endogenous retinal pigment epithelial (RPE) chromophores throughout the cytoplasm. Other melanosomes were preloaded with a photosensitizer before phagocytosis, and cells were light treated to generate ROIs specifically at the granule surface. Phagosome movement was analyzed by live cell imaging. Also analyzed were phagocytized black latex beads, phagocytized melanosomes pretreated to simulate age-related melanin photobleaching, and endogenous RPE melanosomes in primary cultures of porcine retinal pigment epithelium.

Results: Sublethal blue light treatment slowed the movement of some, but not all, phagocytized melanosomes. All phagosomes slowed when ROIs were generated near the organelles through a photosensitized reaction. Melanosome photobleaching, which makes granules more photoreactive, increased the effects of blue light. Blue light treatment also slowed the motility of phagosomes containing latex beads and endogenous pigment granules.

Conclusions: Blue light-induced stress impairs phagosome motility in RPE cells but affects individual organelles differently, suggesting that the effects of mild oxidative injury vary with subcellular location. The mechanisms underlying slowed motility are at least partially local because slowing can be induced by a photosensitized reaction in the subdomain of the organelle and the magnitude of the slowing is greater when the phagosome contents are photoreactive. Photic stress may impair the movement and positioning of RPE organelles, which would have widespread consequences for maintaining a functionally efficient subcellular organization.


Figures

Figure 1
Figure 1
Baseline motility of phagocytized melanosomes. (A) Bright-field image of ARPE-19 cells showing internalized granules, five of which are circled and numbered. (B) The same bright-field image as in (A), on which is superimposed the trajectory for the movement of phagosome number 5 over 30 minutes. (C) Graphical display of organelle trajectories demonstrating variations in movement patterns over 120 minutes for three organelles (1, 4, and 5). (D) Comparison of the total distance traveled (mean ± SD) by organelles in two successive 30-minute intervals (n = 70) in the absence of light treatment.
Figure 2
Figure 2
Motility of phagocytized melanosomes after sublethal blue light treatment of ARPE-19 cells. (A) Graphical display of the movement of a single representative organelle at baseline (30 minutes), during 10 minutes of blue light treatment, and over a 30-minute posttreatment interval. Data shown are from 840 images captured at 5-second intervals. (B) Illustration of the total distance traveled in 30 minutes by organelles in untreated control cultures and in blue light–treated cultures. Motility for 10 individual organelles in each group is shown at baseline (interval 1, open bars) and after light treatment (interval 2, solid black bars) or at the corresponding interval for control cultures (solid gray bars). Numbers above the bars indicate the percentage change in distance traveled between interval 1 (baseline) and interval 2. (C) Total distance traveled (mean ± SD) by organelles in untreated control cells (n = 38 organelles) and in light-treated cells (n = 30 organelles) during interval 1 (baseline, open bars) and interval 2 (solid bars). Data are from one representative experiment. Organelles in light-treated cells moved significantly more slowly (P < 0.05, t-test).
Figure 3
Figure 3
Morphologic effects of blue light treatment on ARPE-19 cells. Upper: phase-contrast images of the same microscope field before (pre), immediately after (immediate post), and 6 hours after (6 hr post) sublethal light treatment. Lower: replicate cultures with Hoechst-stained nuclei showing the unchanged rhodamine phalloidin–stained actin cytoskeleton with sublethal blue light treatment. The last image illustrates the appearance of the actin cytoskeleton after lethal photic stress; cells were irradiated with levels of blue light sufficient to induce apoptosis, as described in Zareba et al. Scale bars: 40 μm (phase micrographs), 20 μm (fluorescence micrographs).
Figure 4
Figure 4
Effect of melanosome photobleaching on phagosome movement in ARPE-19 cells treated with sublethal blue light. Phagocytized granules were unbleached (0 hour) or photobleached for 31 or 45 hours before delivery to ARPE-19 cells. (A) Organelle movement at baseline (open bars) and after light treatment (solid bars). Data are mean total distance traveled over 30 minutes (±SD) for 40 organelles per group; all groups differed significantly from each other (P < 0.05, t-test). (B) Percentage of organelles that slow substantially on blue light treatment (defined as a 50% or greater decrease in distance traveled compared with baseline) as a function of melanosome photobleaching time.
Figure 5
Figure 5
Motility of phagocytized black latex beads in ARPE-19 cells (upper) and endogenous melanosomes in porcine RPE cells (lower) after sublethal blue light treatment. Each panel shows a bright-field image of the cells illustrating the organelles, a graphical display of the movement of a single representative organelle before (baseline), during (blue light), and after light treatment (interval 2) and comparison of the mean distance traveled at baseline interval 1 (open bars) and interval 2 (solid bars) in control and light-treated cultures. Data are the total distances traveled over 30 minutes (mean ± SD) for 22 to 30 organelles per group. Organelles in treated but not control cells moved significantly more slowly during interval 2 (P < 0.05, t-test).
Figure 6
Figure 6
Motility within ARPE-19 cells of phagocytized melanosomes after induction of a local photosensitized reaction with green light. (A) Control experiment showing no effect of green light irradiation on the motility of phagosomes containing photosensitizer-free melanosomes. Left: distance traveled in 30 minutes at baseline (interval 1, open bars) and after green light treatment (interval 2, solid bars) for 10 individual organelles showing random variations in motility. Numbers over the bars are the percentage change in distance traveled between intervals. Right: distance traveled (mean ± SD) for 30 organelles at baseline and after green light treatment. Distance traveled does not differ between intervals. (B) Green light irradiation of cells containing phagocytized melanosomes preloaded with photosensitizer (rB). Top: graphical display of the movement of a single representative rB-loaded organelle before (baseline), during (green light), and after (interval 2) treatment with green light. Data shown are from 840 images captured at 5-second intervals. Lower left: distance traveled at baseline (open bars) and after green light treatment (solid bars) for 10 individual organelles, demonstrating slowing of all organelles. Lower right: distance traveled (mean ± SD) for 25 organelles shows a significant green light–induced decrease in organelle motility (P < 0.05, t-test).
Figure 7
Figure 7
(A) Graphical illustration of the motility within the same ARPE-19 cell of two types of phagosomes. Data shown are from 360 images captured at 5-second intervals showing the distance traveled over 30 minutes (10 minutes each before, during, and after treatment with green light) for a single representative phagosome of each type. Phagosomes contained either a black latex bead (top) or an rB-loaded melanosome (bottom). (B) Fluorescence (top) and bright-field (bottom) image of the same cell show that beads can be distinguished from melanosomes because of the endogenous fluorescence of the beads. Phagosomes that contain beads are indicated by arrows. Phagosomes that contain melanosomes are indicated by circles in the bright-field image.

References

    1. Barral DC, Seabra MC. The melanosome as a model to study organelle motility in mammals. Pigment Cell Res. 2004;17:111–118. - PubMed
    1. Futter CE. The molecular regulation of organelle transport in mammalian retinal pigment epithelial cells. Pigment Cell Res. 2006;19:104–111. - PubMed
    1. Seabra MC, Coudrier E. Rab GTPases and myosin motors in organelle motility. Traffic. 2004;5:393–399. - PubMed
    1. Lopes VS, Ramalho JS, Owen DM, et al. The ternary Rab27a-Myrip-Myosin VIIa complex regulates melanosome motility in the retinal pigment epithelium. Traffic. 2007;8:486–499. - PMC - PubMed
    1. Aslan M, Ryan TM, Townes TM, et al. Nitric oxide-dependent generation of reactive species in sickle cell disease: actin tyrosine induces defective cytoskeletal polymerization. J Biol Chem. 2003;278:4194–4204. - PubMed

Publication types

Substances