. 2008 Dec;7(12):3739-50.
doi: 10.1158/1535-7163.MCT-08-0548.

ESE-1/EGR-1 pathway plays a role in tolfenamic acid-induced apoptosis in colorectal cancer cells

Affiliations

ESE-1/EGR-1 pathway plays a role in tolfenamic acid-induced apoptosis in colorectal cancer cells

Seong-Ho Lee et al. Mol Cancer Ther. 2008 Dec.

Abstract

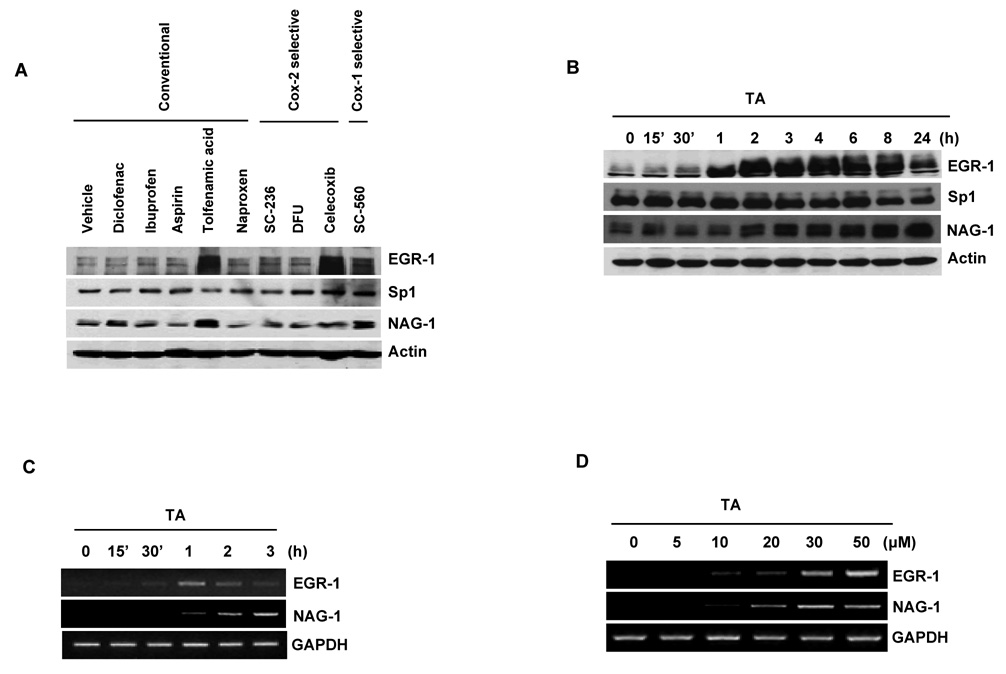
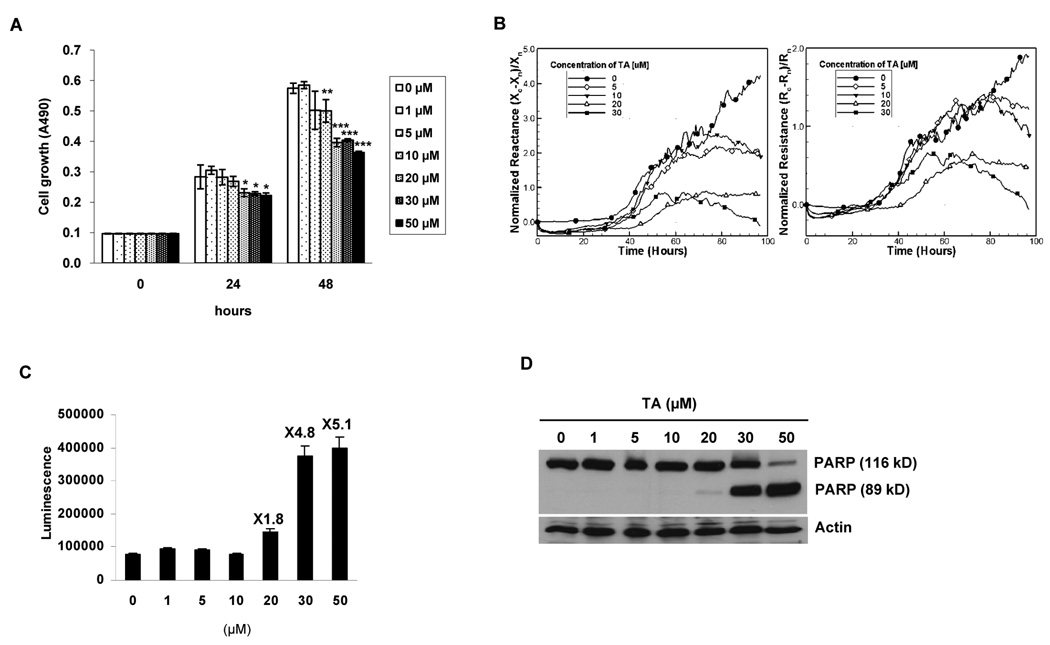
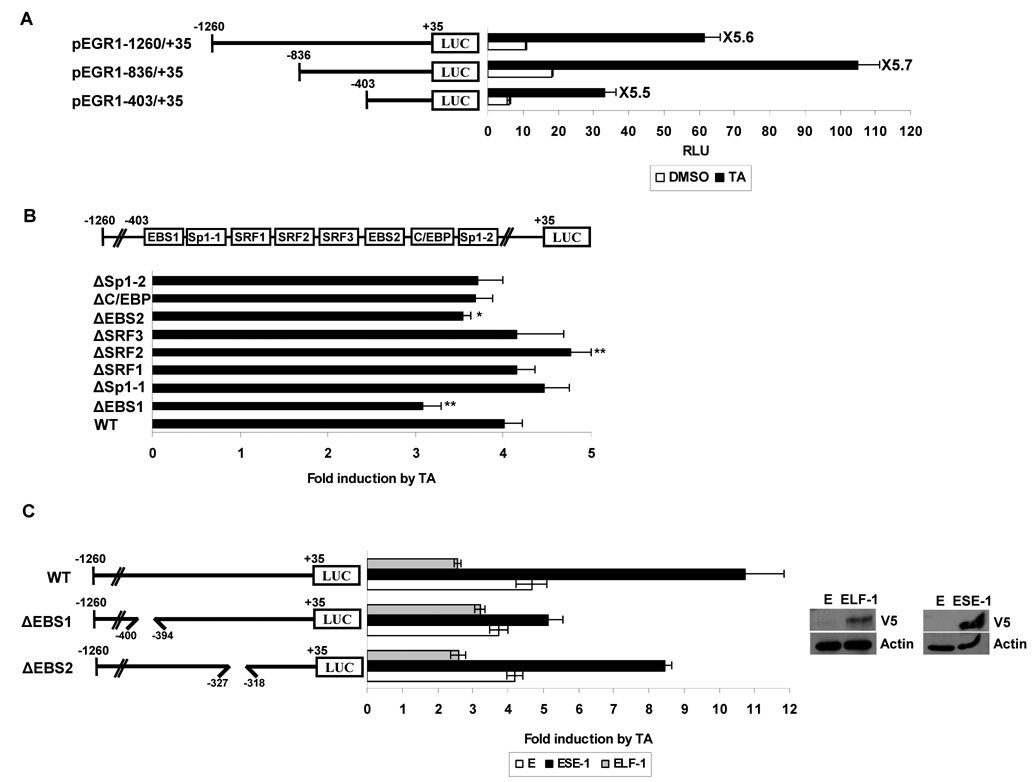
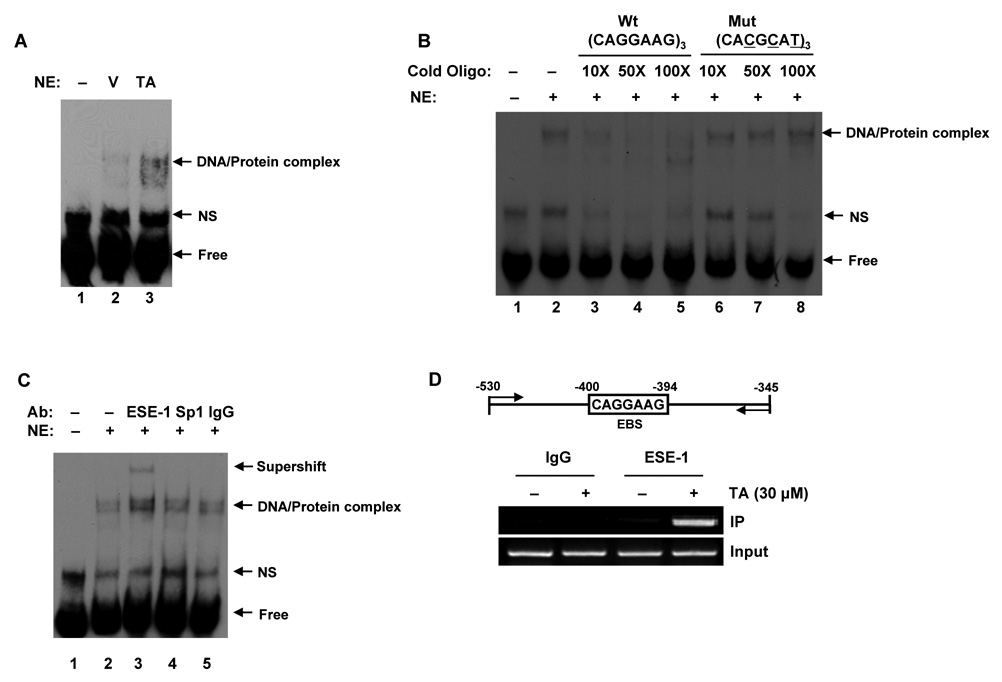
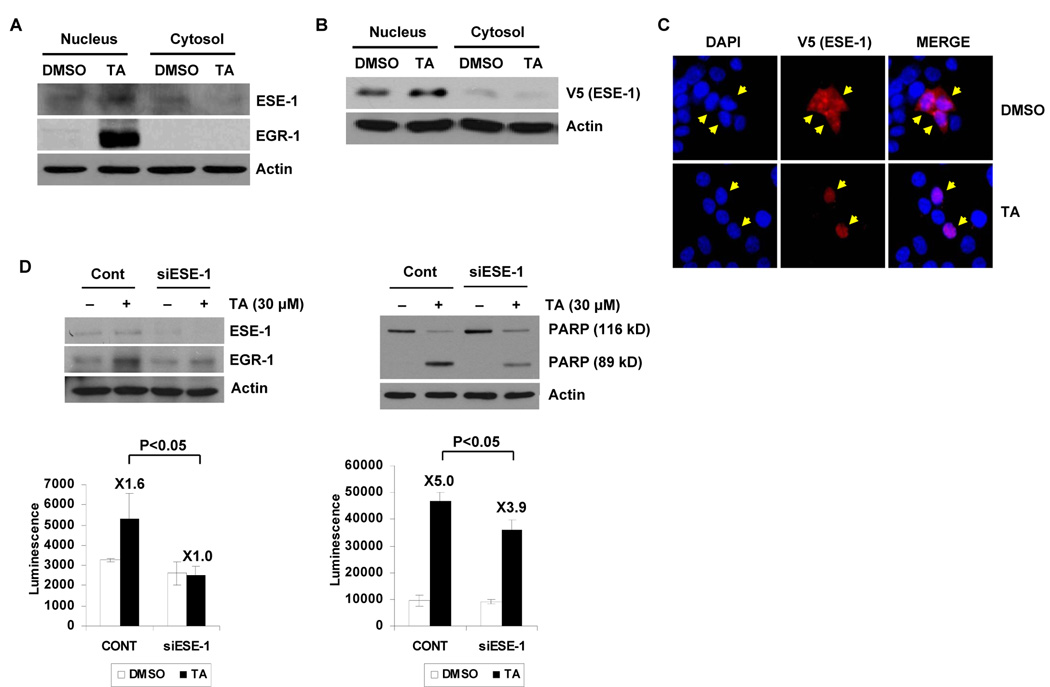
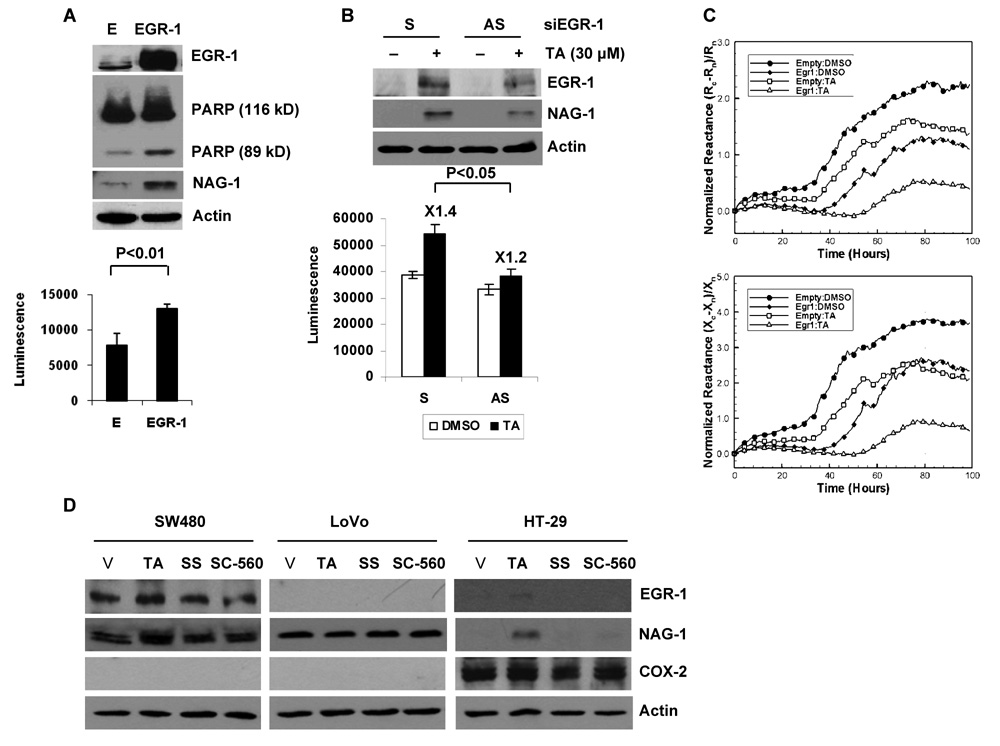
Nonsteroidal anti-inflammatory drugs (NSAIDs) are known to prevent colorectal tumorigenesis. Although antitumor effects of NSAIDs are mainly due to inhibition of cyclooxygenase activity, there is increasing evidence that cyclooxygenase-independent mechanisms may also play an important role. The early growth response-1 (EGR-1) gene is a member of the immediate-early gene family and has been identified as a tumor suppressor gene. Tolfenamic acid is a NSAID that exhibits anticancer activity in a pancreatic cancer model. In the present study, we investigated the anticancer activity of tolfenamic acid in human colorectal cancer cells. Tolfenamic acid treatment inhibited cell growth and induced apoptosis as measured by caspase activity and bioelectric impedance. Tolfenamic acid induced EGR-1 expression at the transcription level, and analysis of the EGR-1 promoter showed that a putative ETS-binding site, located at -400 and -394 bp, was required for activation by tolfenamic acid. The electrophoretic mobility shift assay and chromatin immunoprecipitation assay confirmed that this sequence specifically bound to the ETS family protein epithelial-specific ETS-1 (ESE-1) transcription factor. Tolfenamic acid also facilitated translocation of endogenous and exogenous ESE-1 to the nucleus in colorectal cancer cells, and gene silencing using ESE-1 small interfering RNA attenuated tolfenamic acid-induced EGR-1 expression and apoptosis. Overexpression of EGR-1 increased apoptosis and decreased bioelectrical impedance, and silencing of endogenous EGR-1 prevented tolfenamic acid-induced apoptosis. These results show that activation of ESE-1 via enhanced nuclear translocation mediates tolfenamic acid-induced EGR-1 expression, which plays a critical role in the activation of apoptosis.


Figures

Figure 1
Figure 1. Tolfenamic acid (TA) increases the expression of EGR-1 and NAG-1 in human colorectal cancer cells
A Screening of various NSAIDs based on EGR-1 and NAG-1 expression. HCT-116 cells were incubated with the indicated NSAIDs at 30 µmol/L for 6 h. Total cell lysates were harvested and subsequently Western blot analysis was performed for EGR-1, Sp1, NAG-1, and actin as described in Materials and Methods. B Western blot analysis. HCT-116 cells were serum-starved overnight and treated with 30 µmol/L of TA for 0, 15’, 30’, 1, 2, 3, 4, 6, 8, and 24 h. Total cell lysates were harvested, and subsequently Western blot analysis was performed. C Time-dependent expression of EGR-1 and NAG-1. After serum starvation overnight, HCT-116 cells were treated with 30 µmol/L of TA for 0, 15’, 30’, 1, 2, and 3 h. RT-PCR was performed for EGR-1 and NAG-1 as described in Materials and Methods. GAPDH represents a loading control. D Dose-dependent expression of EGR-1 and NAG-1. After serum starvation, HCT-116 cells were treated with 0, 5, 10, 20, 30, and 50 µmol/L of TA for 2 h. RT-PCR was performed.
Figure 2
Figure 2. TA suppresses cell growth and increases apoptosis
A Cell growth. HCT-116 cells were treated with 0, 1, 5, 10, 20, 30, and 50 µmol/L of TA for 0, 24 and 48 h. Cell growth was measured using CellTiter96 Aqueous One Solution Cell Proliferation Assay as described in Materials and Methods. Values are expressed as mean ± SD of three independent experiments. *, P < 0.05; **, P < 0.01; ***, P < 0.001 versus DMSO-treated cells at each time point. B Cellular micro-impedance. Normalized resistance, (Rc-Rn)/Rn, and normalized reactance, (Xc-Xn)/Xn, of HCT116 cells following treatment with 0, 5, 10, 20, and 30 µmol/L of TA were obtained using electrical impedance measurement technique as described in Materials and Methods for indicated time points. The subscripts c and n indicate cell covered and naked scans, respectively. Measurements were performed simultaneously using the same batch of HCT-116 cells. The representative time-dependent normalized resistances and reactances shown here were scanned at 5.62 kHz and 100 kHz, respectively. For the sake of clarity, symbols are selectively marked. C Apoptosis detection (caspase 3/7 activity). HCT-116 cells were treated with 0, 1, 5, 10, 20, 30, and 50 µmol/L of TA for 24 h. Caspase 3/7 activity was measured as described in Materials and Methods. The data represent mean ± SD from three independent experiments. D Apoptosis detection (PARP cleavage). HCT-116 cells were treated with 0, 1, 5, 10, 20, 30, and 50 µmol/L of TA for 24 h. Poly ADP ribose polymerase (PARP) cleavage was measured using Western blot analysis.
Figure 3
Figure 3. ETS binding site (EBS) located at −400 to −394 of the EGR-1 promoter is necessary for EGR-1 transcription induced by TA
A Structures of EGR-1 sequential deletion constructs and deletion promoter assay. The EGR-1 promoter fragments of a different length but with the same 3'-end were cloned into pGL3-Basic. HCT-116 cells were co-transfected with 0.5 µg of each reporter construct containing the EGR-1 promoter and 0.05 µg of pRL-null vector using Lipofectamine. After growth overnight with fresh media, the cells were treated with 30 µmol/L of TA for 24 h. Luciferase activity was measured as a ratio of firefly luciferase signal/renilla luciferase signal and was shown as mean ± S.D. of three independent transfections. B The putative transcription binding sites within the −403 to +35 region in the EGR-1 promoter and luciferase assay with internal deletion clones. The boxes in the promoter represent the binding site of indicated transcription factors and are used for construction of internal deletion clones. HCT-116 cells were co-transfected with 0.5 µg of each internal deletion construct of the EGR-1 promoter and 0.05 µg of pRL-null vector using Lipofectamine and treated with 30 µmol/L of TA for 24 h. The X axis shows fold induction over vehicle as 1.0. The results are presented as means ± S.D. of three independent transfections. *, P < 0.05; **, P < 0.01 versus pEGR1-1260/+35 WT transfected cells. C Effect of ESE-1 overexpression on EGR-1 transactivation. HCT-116 cells were co-transfected with wild type EGR-1 promoter (pEGR1-1260/+35 WT or internal deletion clone pEGR1-1260/+35ΔEBS) in the presence of empty (E), ESE-1, or ELF-1 expression vector using Lipofectamine. After growth overnight with fresh media, the cells were treated with 30 µmol/L of TA for 24 h. The X axis shows fold induction over vehicle as 1.0. The results are presented as the means ± S.D. of three independent transfections. The overexpression of ELF-1 and ESE-1 was confirmed by Western analysis using V5 tag (GKPIPNPLLGLDST) antibody.
Figure 4
Figure 4. Identification of TA-responsive DNA binding activity of ESE-1 in the EGR-1 promoter
A Electrophoretic mobility shift assay (EMSA). After serum starvation overnight, HCT-116 cells were treated with DMSO (V) or 30 µmol/L of TA (TA) for 2 h and EMSA was performed using nuclear extracts (5 µg), as described in Materials and Methods. The specific DNA-protein complexes are indicated by arrows. NE, nuclear extract; NS, non specific. B Competition assay. The competition of the DNA binding was obtained using a 10, 50, and 100-time excess of the unlabeled oligonucleotide (lane 3–5). The specificity of the complex for EBS was confirmed by the absence of competition with an excess of cold EBS mutated oligonucleotide (lane 6–8). C Supershift experiment. A gel supershift experiment was performed to detect binding activity of ESE-1 to EBS after exposure to 30 µmol/L of TA. The indicated antibodies were added to the incubation mixture. An arrow indicates the antibody-induced supershift band. The EMSA conditions and the sequence of the probes used in the experiment are described in Materials and Methods. D Chromatin immunoprecipitation (ChIP) assay. After serum starvation overnight, HCT-116 cells were treated with 30 µmol/L of TA for 2 h. The in vivo DNA-protein complexes were cross-linked by formaldehyde treatment, and chromatin pellets were extracted and sonicated. The associated EGR-1 DNA was isolated as described in Materials and Methods. The sequence of the human EGR-1 promoter region (−530/−345) was amplified by PCR primer pairs as indicated by the arrows. The input represents PCR products obtained from 1% aliquots of chromatin pellets prior to immunoprecipitation.
Figure 5
Figure 5. TA mediates translocation of ESE-1 into the nucleus, and siRNA-mediated inhibition of ESE-1 expression suppressed TA-induced EGR-1 expression and apoptosis
A Nuclear translocation of endogenous ESE-1. HCT-116 cells were serumstarved overnight and then treated with 30 µmol/L of TA for 2 h. Nuclear and cytosol fractions were isolated, and Western blot analysis was performed for ESE-1, EGR-1, and actin antibodies. B Nuclear translocation of exogenous ESE-1. HCT-116 cells were transiently transfected with pcDNA3.1/V5-His/ESE-1 expression vector using Lipofectamine as described in Materials and Methods. After serum-starvation overnight, the cells were treated with 30 µmol/L of TA for 1 h. Nuclear and cytosol fractions were isolated, and Western blot was performed for V5 and actin antibodies. C Immunohistochemistry. After transfection as described in (B), the cells were serum-starved overnight and treated with 30 µmol/L of TA for 1 h. The cells were fixed and stained with anti-V5 antibody overnight and subsequently, secondary anti-mouse TRITC conjugate (red). DAPI staining was used to visualize the nucleus of the cells (blue). Magnifications correspond to 400X. The arrows indicate ESE-1 localization. D Effect of ESE-1 knockdown on TA-induced EGR-1 expression and apoptosis. HCT-116 cells were transfected with control siRNA (100 nmol/L) or ESE-1 siRNA (100 nmol/L) for 24 h using a TransIT-TKO transfection reagent. After serum starvation overnight, the cells were treated with 30 µmol/L of TA for 2 h (left panel) or for 24 h (right panel). Western blot analysis was performed for ESE-1, EGR-1, PARP, and actin antibodies, and caspase 3/7 activity was measured as described in Materials and Methods. The same cell lysates were used to measure caspase 3/7 activity as described in Materials and Methods (bottom panels). The data represent mean ± SD from three independent experiments.
Figure 6
Figure 6. EGR-1 induces apoptosis and mediates TA-induced apoptosis
A Apoptosis detection after EGR-1 overexpression. HCT-116 cells were transfected with the empty or EGR-1 expression vector. PARP cleavage was measured by Western blot analysis (top panel) and caspase 3/7 activity (bottom panel) was determined as described in Materials and Methods. The data represent mean ± SD from three independent experiments. B Effect of EGR-1 knockdown on TA-induced apoptosis. HCT-116 cells were transfected with sense (S) or anti-sense (AS) oligo for human EGR-1 as described in Materials and Methods. After serum starvation overnight, the cells were treated with 30 µmol/L of TA for 2 h. Western analysis was performed for NAG-1 and actin antibodies (top panel), and caspase 3/7 activity (bottom panel) was measured. The data represent mean ± SD from three independent experiments. C Cellular micro-impedance to detect the effect of EGR-1 transfection. Normalized resistance, (Rc-Rn)/Rn, and normalized reactance, (Xc-Xn)/Xn, of HCT116 cells transiently transfected with empty (E) or EGR-1 expression vector following treatment with TA were measured using the cellular micro-impedance measurement technique as described in Materials and Methods. The representative time-dependent normalized resistances and reactances shown here were scanned at 5.62 kHz and 100 kHz, respectively. Filled symbols represent cell measurements with DMSO, and blank symbols represent cells treated with 30 µmol/L of TA. For the sake of clarity, symbols are selectively marked. D Expression of EGR-1, NAG-1 and COX-2 in other colorectal cancer cells. SW480, LoVo and HT-29 cells were grown, serum starved overnight, and treated with 30 µmol/L of TA, sulindac sulfide (SS) and SC-560 for 2 h. Western blot analysis was performed for EGR-1, NAG-1, COX-2, and actin antibodies.

References

    1. Huls G, Koornstra JJ, Kleibeuker JH. Non-steroidal anti-inflammatory drugs and molecular carcinogenesis of colorectal carcinomas. Lancet. 2003;362:230–232. - PubMed
    1. Gupta RA, Dubois RN. Colorectal cancer prevention and treatment by inhibition of cyclooxygenase-2. Nat Rev Cancer. 2001;1:11–21. - PubMed
    1. Grosch S, Tegeder I, Niederberger E, Brautigam L, Geisslinger G. COX-2 independent induction of cell cycle arrest and apoptosis in colon cancer cells by the selective COX-2 inhibitor celecoxib. Faseb J. 2001;15:2742–2744. - PubMed
    1. Sheng H, Shao J, Kirkland SC, et al. Inhibition of human colon cancer cell growth by selective inhibition of cyclooxygenase-2. J Clin Invest. 1997;99:2254–2259. - PMC - PubMed
    1. Leahy KM, Ornberg RL, Wang Y, Zweifel BS, Koki AT, Masferrer JL. Cyclooxygenase-2 inhibition by celecoxib reduces proliferation and induces apoptosis in angiogenic endothelial cells in vivo. Cancer Res. 2002;62:625–631. - PubMed

Publication types

MeSH terms