. 2008 Dec 15;68(24):10034-9.
doi: 10.1158/0008-5472.CAN-08-1687.

p53 Small-molecule inhibitor enhances temozolomide cytotoxic activity against intracranial glioblastoma xenografts

Affiliations

p53 Small-molecule inhibitor enhances temozolomide cytotoxic activity against intracranial glioblastoma xenografts

Eduard B Dinca et al. Cancer Res. .

Abstract

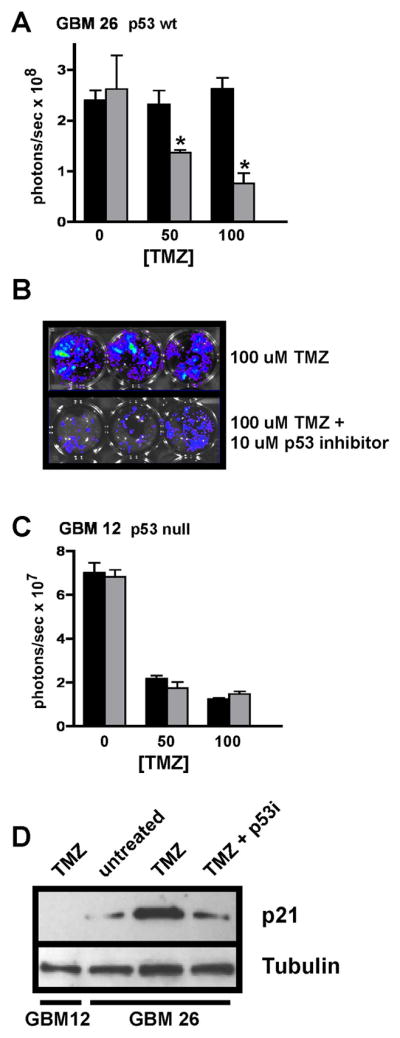
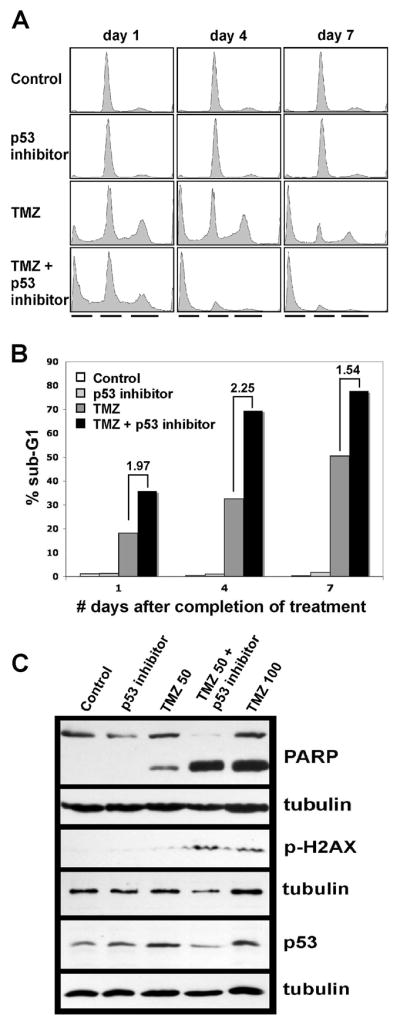
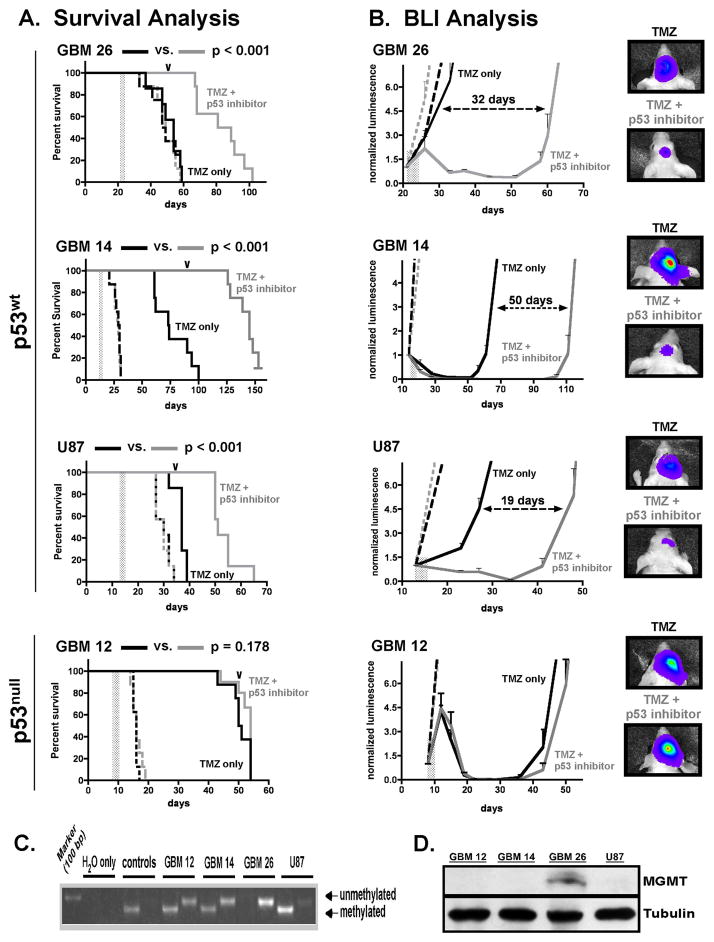
In this study, we investigated the precursor and active forms of a p53 small-molecule inhibitor for their effects on temozolomide (TMZ) antitumor activity against glioblastoma (GBM), using both in vitro and in vivo experimental approaches. Results from in vitro cell viability analysis showed that the cytotoxic activity of TMZ was substantially increased when p53 wild-type (p53(wt)) GBMs were cotreated with the active form of p53 inhibitor, and this heightened cytotoxic response was accompanied by increased poly(ADP-ribose) polymerase cleavage as well as elevated cellular phospho-H2AX. Analysis of the same series of GBMs, as intracranial xenografts in athymic mice, and administering corresponding p53 inhibitor precursor, which is converted to the active compound in vivo, yielded results consistent with the in vitro analyses: TMZ + p53 inhibitor precursor cotreatment of three distinct p53(wt) GBM xenografts resulted in significant enhancement of TMZ antitumor effect relative to treatment with TMZ alone, as indicated by serial bioluminescence monitoring as well as survival analysis (P < 0.001 for cotreatment survival benefit in each case). Mice receiving intracranial injection with p53(null) GBM showed similar survival benefit from TMZ treatment regardless of the presence or absence of p53 inhibitor precursor. In total, our results indicate that the p53 active and precursor inhibitor pair enhances TMZ cytotoxicity in vitro and in vivo, respectively, and do so in a p53-dependent manner.


Figures

Figure 1
Figure 1
In vitro cell viability analysis of GBM xenograft explant cultures subjected to TMZ +/− p53 inhibitor treatments. A) GBM 26 cells were treated with TMZ only (black) at the indicated concentrations, or with TMZ + 10 μM cyclic pifithrin-α p-nitro (gray). Treatments were administered 1x/day for three consecutive days (each treatment group consisting of triplicate samples), and 4 days following final treatment the luminescence of each treatment group (Figure 1B) was determined. Average values for each treatment group are shown, with standard error of mean indicated. Asterisks denote comparisons for which there is a significant difference (p < 0.05) between TMZ only vs. TMZ + p53 inhibitor treatments. C) The same experimental design as described for GBM 26 was used for assessing p53null GBM 12 cell response to treatments, with results presented as indicated for panel A. D) Immunoblot results for p21 expression in cells treated with TMZ +/− p53 inhibitor (p53i). TMZ (100 μM) induces p21 expression in cells with wild-type p53 (GBM 26), and this induction is suppressed through concurrent treatment with p53 inhibitor (incubations as described above for panels A and C). In contrast to the results for GBM 26, p21 is not detected in p53null GBM 12 cells, irrespective of treatment (shown) or lack of treatment with TMZ. Replicate samples for this analysis yielded similar results.
Figure 2
Figure 2
Flow cytometry and immunoblot analysis of U87 cells subjected to TMZ +/− cyclic pifithrin-α p-nitro inhibitor treatments. A) Cell treatments were as follows: control = DMSO only; p53 inhibitor only = 10 μM cyclic pifithrin-α p-nitro administered daily for 3 consecutive days; TMZ only = 50 or 100 μM TMZ administered daily for 3 consecutive days; 50 or 100 μM TMZ + 10 μM p53 inhibitor administered daily for 3 consecutive days. Cells were harvested from individual plates on the days indicated (values represent days following final treatment administration) and prepared for flow cytometry analysis. Associated flow cytometry profiles show similar amounts of and predominant G1 phase cell fractions in control and p53 inhibitor only samples at each time point, whereas time-dependent increases in proportion of sub-G1 cell fractions are evident in the TMZ only and the TMZ + p53 inhibitor series (black lines beneath each column of profiles indicate, from left to right, the positions of the sub-G1, G1, and G2/M cell fractions). Results shown are for 100 uM TMZ treatments. B) Bar graph showing sub-G1 ratios for TMZ + p53 inhibitor vs. TMZ only treatments, and indicating that the proportion of sub-G1 cells is largest, at each time point, in cultures subjected to combined TMZ + p53 inhibitor treatment. C) Immunoblot results for U87 cells subjected to control and p53 inhibitor only treatments as described above, and to combination treatments with 50 or 100 uM TMZ +/− p53 inhibitor. Results are for cells 4 days after final treatment administration, and show presence or absence of cleaved PARP, presence or absence of phospho-H2AX, and relative amounts of p53 protein; each tubulin result is presented beneath the corresponding result obtained from the same filter, and address total protein loading variation. Note the lack of effect of TMZ on p53 expression (middle and far right lanes of p53 immunoblot panel), which is consistently observed in tumors expressing p53.
Figure 3
Figure 3
Intracranial xenograft therapy-response to TMZ +/− p53 inhibitor precursor treatments. Groups of 32 mice received intracranial tumor cell injection (300,000 cells/mouse) using luciferase-modified GBM, and at times when log-phase growth was indicated by BLI, each series of mice was randomized into four treatment groups with 8 mice/group, and treatments were initiated. Treatment groups were as follows: control (intraperitoneal injection of DMSO + gavage with TMZ suspension vehicle, 1x/day for 3 days: broken black line); p53 inhibitor precursor only (0.25 mg in 50 ul DMSO administered by intraperitoneal injection 1x/day for 3 days: broken gray line); TMZ only (10 mg/kg administered in oral suspension vehicle by gavage, 1x/day for 3 days for GBMs 12, 14, and U87, and 50 mg/kg 1x/day for 3 days for GBM 26: solid black line); or combination TMZ + p53 inhibitor (solid gray line), as indicated for each agent’s use alone. Treatment periods are indicated by a vertical gray bar in each of the graphs in panels A and B. A) Survival plots for each experiment show that combined TMZ + p53 inhibitor precursor treatment significantly extends symptom-free survival relative to TMZ alone in mice with p53wt tumor (GBM 26, GBM 14, and U87), but not in mice with p53null GBM 12. P-values indicated at the top of each graph are for TMZ alone vs. TMZ + p53 inhibitor precursor comparisons. B) Corresponding bioluminescence imaging curves, with plots beginning at day of treatment initiation, and showing either lack of effect or suppression of luminescence resulting from TMZ +/− p53 inhibitor precursor treatments (mean luminescence values plotted for each treatment group, with standard error of mean indicated). For the plots involving GBM 26, GBM 14, and U87, the number of days between log phase tumor growth for TMZ only and TMZ + p53 inhibitor precursor treatment groups is indicated, and the order of these differences (largest to smallest) is consistent with the order for corresponding length of survival benefit (see Table 1). To the far right are luminescence intensity overlay images. For mice with intracranial GBM 14, GBM 26, or U87, mice with lowest and highest intracranial tumor luminescence in TMZ only and TMZ + p53 inhibitor treatment groups, respectively, are shown, with images captured at days indicated by the arrowheads along the TMZ + p53 inhibitor plots in panel A. For GBM 12, which does not show additional response to combination treatment beyond that associated with TMZ alone, image overlays are shown for mice that define the median tumor luminescence from each group at the day indicated by the arrowhead over the corresponding graph in panel A. C) MGMT promoter methylation analysis showing lack of methylation in GBM 26, which has corresponding detectable protein expression (panel D), and displays resistance to TMZ alone (panel A). Results for tumors GBM 12, GBM 14, and U87 show presence of MGMT promoter ethylation, and corresponding lack of detectable protein by immunoblot.

References

    1. Roth JA, Nguyen D, Lawrence DD, et al. Retrovirus-mediated wild-type p53 gene transfer to tumors of patients with lung cancer. Nat Med. 1996;2:985–91. - PubMed
    1. Levesque AA, Eastman A. p53-based cancer therapies: Is defective p53 the Achilles heel of the tumor? Carcinogenesis. 2007;28:13–20. - PubMed
    1. Johnson KR, Fan W. Reduced expression of p53 and p21WAF1/CIP1 sensitizes human breast cancer cells to paclitaxel and its combination with 5-fluorouracil. Anticancer Res. 2002;22:3197–204. - PubMed
    1. Wang Y, Zhu S, Cloughesy TF, Liau LM, Mischel PS. p53 disruption profoundly alters the response of human glioblastoma cells to DNA topoisomerase I inhibition. Oncogene. 2004;23:1283–90. - PubMed
    1. Kuo PC, Liu HF, Chao JI. Survivin and p53 modulate quercetin-induced cell growth inhibition and apoptosis in human lung carcinoma cells. J Biol Chem. 2004;279:55875–85. - PubMed

Publication types

MeSH terms