. 2009 Feb 1;587(3):551-65.
doi: 10.1113/jphysiol.2008.161737. Epub 2008 Dec 15.

The Timothy syndrome mutation of cardiac CaV1.2 (L-type) channels: multiple altered gating mechanisms and pharmacological restoration of inactivation

Affiliations

The Timothy syndrome mutation of cardiac CaV1.2 (L-type) channels: multiple altered gating mechanisms and pharmacological restoration of inactivation

Viktor Yarotskyy et al. J Physiol. .

Abstract

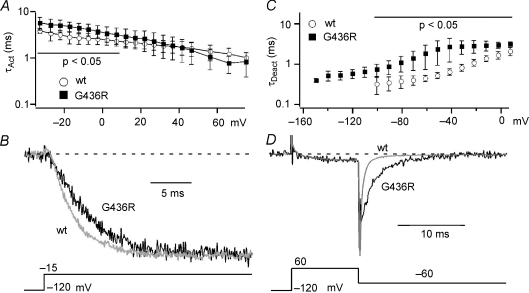
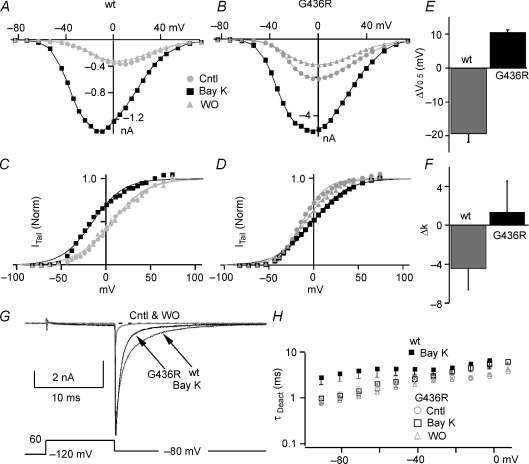
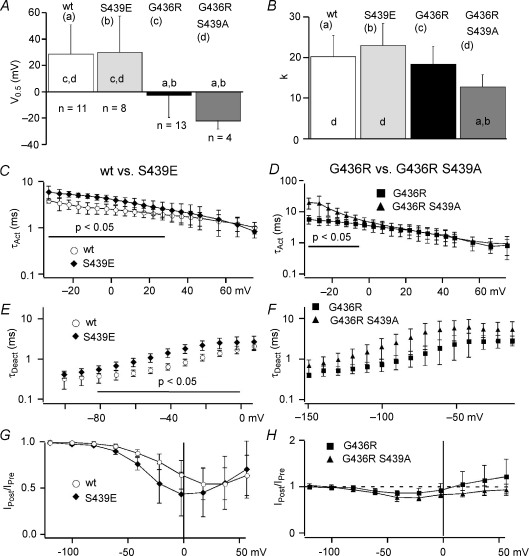
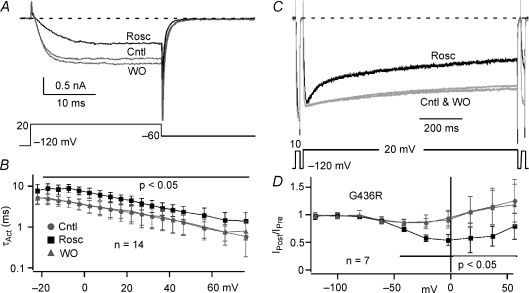
Timothy syndrome (TS) is a multiorgan dysfunction caused by a Gly to Arg substitution at position 406 (G406R) of the human CaV1.2 (L-type) channel. The TS phenotype includes severe arrhythmias that are thought to be triggered by impaired open-state voltage-dependent inactivation (OSvdI). The effect of the TS mutation on other L-channel gating mechanisms has yet to be investigated. We compared kinetic properties of exogenously expressed (HEK293 cells) rabbit cardiac L-channels with (G436R; corresponding to position 406 in human clone) and without (wild-type) the TS mutation. Our results surprisingly show that the TS mutation did not affect close-state voltage-dependent inactivation, which suggests different gating mechanisms underlie these two types of voltage-dependent inactivation. The TS mutation also significantly slowed activation at voltages less than 10 mV, and significantly slowed deactivation across all test voltages. Deactivation was slowed in the double mutant G436R/S439A, which suggests that phosphorylation of S439 was not involved. The L-channel agonist Bay K8644 increased the magnitude of both step and tail currents, but surprisingly failed to slow deactivation of TS channels. Our mathematical model showed that slowed deactivation plus impaired OSvdI combine to synergistically increase cardiac action potential duration that is a likely cause of arrhythmias in TS patients. Roscovitine, a tri-substituted purine that enhances L-channel OSvdI, restored TS-impaired OSvdI. Thus, inactivation-enhancing drugs are likely to improve cardiac arrhythmias and other pathologies afflicting TS patients.


Figures

Figure 2
Figure 2. CSvdI is not impaired by the TS mutation
A, the traces show TS mutant (G436R) L-currents evoked by 25 ms pulses to 0 mV from HP −120 mV (*grey), −60 mV (**black), and upon return to −120 mV (***grey). B, the CSvdI time course from TS mutant L-currents was obtained by pulsing (25 ms to 0 mV) at 1 s intervals. Horizontal bar shows the HP =−60 mV duration. Asterisks show the temporal position of currents shown on panel A. C, mean (±s.d.) fractional inactivation is shown for WT (grey, n= 14) and G436R (black, n= 7) channels (not significantly different).
Figure 7
Figure 7. Our L-channel gating model reproduces experimental results from WT and TS channels
A, the scheme for the L-channel model. C0–C4 are closed states and O represents the open state. I0I5 are inactivated states. Kc and K−c are voltage-dependent rate constants for the forward and backward transitions, respectively, between closed states and between inactivated states (Table 1). B, simulations (Sim, black) using WT (filled circles) and TS mutant channel (open circles) models demonstrate good correspondence with experimental results (Exp, grey) for OSvdI. The same voltage protocols were used to generate both simulated and experimental results. C, the TS mutation slows the activation at voltages < 10 mV for both theoretical and experimental data. The symbols have the same meaning as for panel B. D, the TS model nicely reproduces our experimental results on the voltage dependence of τDeact for both WT and TS channels. The symbols have the same meaning as for panel B. E, the WT (filled squares) and TS (open triangles) models were also able to reproduce that effect of Bay K8644 on the τDeactversus voltage relationship and TS mutant channels. The grey symbols represent the experimental results.
Figure 8
Figure 8. The TS mutation induces proarrhythmic changes to Ca2+ influx evoked by the cAP
A, traces illustrate the calcium current generated during the cAP through WT (WT, grey) and TS channels (TS, dark grey). The currents are scaled to the initial portion of the plateau phase and superimposed to highlight the differences. The cAP waveform used to generate these currents is shown below panel B. These currents (panels A–D) were recorded in an external solution containing 5 mm Ca2+ and the time scale bar is the same as for panel C. B, the traces illustrate the effect of 100 μm roscovitine (+Rosc, black) on cAP-generated calcium currents through TS channels (TS, dark grey). The currents are scaled to the initial portion of the plateau phase and superimposed. C, the calcium current generated by the cAP (above) is used to illustrate the calculation of excess charge (double hatched area), and the horizontal dashed line (threshold line) delineates the plateau phase of inward calcium current. Vertical dashed lines illustrate the section of the cAP over which the excess charge is observed. To calculate the fractional excess charge, we determine the charge under the threshold line (Z; single hatched area) as well as the total charge influx (ZT; single + double hatched areas). Fractional excess charge is calculated by the ratio (ZTZ)/ZT. D, fractional excess charge is near zero for WT channels (0.03 ± 0.02, n= 4), but is significantly increased by the TS mutation (G436R, 0.22 ± 0.06, n= 4). Roscovitine reduces the fractional excess charge in dose-dependent manner. The bar graph shows data for control (C), 30 μm roscovitine (30 R), and 100 μm roscovitine (100 R). Each column is marked by a letter in parentheses, and statistically significant difference (P < 0.05) is shown in the vertically oriented letters. E and F, simulated cAP (E) and the underlying calcium currents (F) illustrate proarrhythmic properties of TS-induced changes in L-channel gating. The WT cAP is generated with 100% of the calcium conductance contributed by the WT L-channel model. The calcium conductance for all TS cAPs is composed of 88.5% WT and 11.5% TS model (Splawski et al. 2004). The three models used are TS (slowed deactivation + Zero OSvdI), TSSD (only slowed deactivation) and TS0I (only Zero OSvdI). The calcium currents (F) are shown for 100% WT (WT, thick grey trace) and for a conductance mixture of 88.5% WT (WT, thin grey trace) and 11.5% TS model (thick black trace). In spite of a relatively small membrane conductance, the TS model generated a larger current during the repolarization phase of the cAP.
Figure 1
Figure 1. Timothy syndrome mutation impairs OSvdI
A, representative records (top) of L-currents evoked by a three-pulse voltage protocol (bottom) for WT (grey) and G436R (TS) channels (black). The prepulse (IPre) and postpulse (IPost) currents were elicited by 25 ms steps to 0 mV, while inactivation was induced by a 1000 ms step to +20 mV. Currents were normalized to IPre. B, the plot of IPost/IPre ratio versus 1000 ms inactivating voltage demonstrates impaired OSvdI for G436R (▪, n= 7) versus WT L-channels (○, n= 14). Error bars show standard deviation. The bold horizontal line shows the voltage range over which OSvdI magnitudes for WT and G436R are significantly different (P < 0.05). Dashed line shows IPost/IPre= 1 (no inactivation).
Figure 3
Figure 3. The TS mutation slows activation and deactivation of cardiac L-channels
A, the TS mutation (G436R, filled squares) significantly (P < 0.05, horizontal line) slows activation versus WT (open circles) at voltages < 10 mV. B, representative traces are normalized to the maximum current to illustrate activation kinetics for WT (grey) and TS (G436R, black) channels. The voltage protocol is shown under the traces. C, the TS mutation (G436R, filled squares) significantly (P < 0.05) slows deactivation versus WT (open circles) across all voltages. The data in panels A and C are shown as mean ±s.d.D, the superimposed currents were normalized to peak step current to highlight slowed deactivation kinetics for G436R (black) versus WT (grey) channels. The voltage protocol is shown under the traces.
Figure 4
Figure 4. Effect of (±)-Bay K8644 on WT and TS mutant L-channels
A and B, typical current versus voltage relationship measured from step currents for wild-type (A) and G439R (B) channels for control (Cntl, circles), 0.3 μm (±)-Bay K8644 (Bay K, squares), and washout (WO, triangles). C and D, the activation versus step voltage relationship obtained from tail currents normalized to that following a step to +80 mV is plotted for WT (C) and G436R (D) (same symbols as panel A) channels. The smooth lines are single Boltzmann equation fits to the data to yield V0.5 and slope factor (k). E, the Bay K8644-induced change in activation V0.5V0.5) is negative for WT (grey, n= 3), but positive for G436R (black, n= 3) channels. Data are shown as means ± standard deviation and are significantly different for WT versus TS (P < 0.001). F, the Bay K8644-induced change in activation slope factor (Δk) is negative for WT (grey, n= 3), but not statistically different from zero for G436R (black, n= 3). Data are shown as mean ± standard deviation and are significantly different for WT versus TS mutant (P < 0.05). G, typical traces show the effect of Bay K8644 on tail current. Grey traces are control (Cntl) and washout (WO) for G436R mutant. Black traces are WT (right arrow) and G436R (left arrow) currents plus Bay K8644 (Bay K). The vertical scale lines indicate current amplitude for WT (right line) and G436R (left line). Note that Bay K8644 makes WT deactivation slower than that for TS channels. H, τDeact was determined from single exponential fitting of tail currents measured at the indicated voltage following a 10 ms +60 mV step to activate the channels. τDeact was plotted versus tail voltage for G436R (open symbols), control (Cntl, grey circles), 0.3 μm Bay K8644 (Bay K, squares) and washout (WO, grey triangles) at voltages < −20 mV (not significantly different). The filled squares represent τDeact from WT channels in the presence of Bay K to highlight a difference between Bay K-induced kinetics for WT and TS channels.
Figure 5
Figure 5. Phosphorylation cannot explain the effect of the TS mutation on L-channel gating
All data are presented as means ±s.d.A and B, V0.5 (A) and slope factor (k) (B) were obtained from Boltzmann fitting of the tail current activation versus voltage relationship and are compared among WT (a, n= 11), S439E (b, n= 8), G436R (c, n= 13), and G436R/S439A (d, n= 4) channels. Statistically significant difference (P < 0.05) between the channels is shown as lower case symbols near base of the bars. Gating comparisons of WT (open symbols) versus S439E (♦) channels (C, E, G) and G436R (▪) versus G436R/S439A (▴) channels (D, F, H). C and D, τAct was determined from single exponential fitting as described in Methods and is plotted versus step voltage. E and F, τDeact was determined from single exponential fitting of tail currents as described in Methods. The voltage range over which results are significantly different (P < 0.05) is indicated by a horizontal line. G and H, IPost/IPreversus voltage shows inactivation induced by 1000 ms inactivation steps over a range from −120 mV to +60 mV. Note the left-shift in the relationship for S439E versus WT.
Figure 6
Figure 6. Roscovitine normalizes inactivation of TS mutant L-channels
A, typical records show the effect of 100 μm roscovitine (Rosc, black trace) to slow TS channel activation relative to control (Cntl, grey) and washout (WO, grey). B, τActversus voltage for the TS mutant in control (Cntl, grey circles), 100 μm Rosc (black symbols), and WO (grey triangles). Roscovitine significantly (P < 0.05) slowed activation for voltages > −20 mV (horizontal line). C, roscovitine-enhanced OSvdI of TS (G436R) mutant L-current (Rosc, black trace). Grey traces are control and washout (Cntl & WO). D, the IPost/IPreversus voltage relationship illustrates the normalization of TS mutant channel inactivation by 100 μm roscovitine (black squares) relative to control and washout (grey symbols). Significantly different results (P < 0.05) are indicated by horizontal line. Data are presented as means ±s.d.

References

    1. Alseikhan BA, DeMaria CD, Colecraft HM, Yue DT. Engineered calmodulins reveal the unexpected eminence of Ca2+ channel inactivation in controlling heart excitation. Proc Natl Acad Sci U S A. 2002;99:17185–17190. - PMC - PubMed
    1. Antoons G, Volders PGA, Stankovicova T, Bito V, Stengl M, Vos MA, Sipido KR. Window Ca2+ current and its modulation by Ca2+ release in hypertrophied cardiac myocytes from dogs with chronic atrioventricular block. J Physiol. 2007;579:147–160. - PMC - PubMed
    1. Barrett CF, Tsien RW. The Timothy syndrome mutation differentially affects voltage- and calcium-dependent inactivation of CaV1.2, L-type calcium channels. Proc Natl Acad Sci U S A. 2008;105:2157–2162. - PMC - PubMed
    1. Benson C, White J, De Bono J, O’Donnell A, Raynaud F, Cruickshank C, McGrath H, Walton M, Workman P, Kaye S, Cassidy J, Gianella-Borradori A, Judson I, Twelves C. A phase I trial of the selective oral cyclin-dependent kinase inhibitor seliciclib (CYC202; R-Roscovitine), administered twice daily for 7 days every 21 days. Br J Cancer. 2007;96:29–37. - PMC - PubMed
    1. Bers DM. Calcium and cardiac rhythms: physiological and pathophysiological. Circ Res. 2002;90:14–17. - PubMed

Publication types

MeSH terms

Substances

LinkOut - more resources