. 2009 Mar;58(3):652-62.
doi: 10.2337/db08-1168. Epub 2008 Dec 15.

Expansion of human regulatory T-cells from patients with type 1 diabetes

Affiliations

Expansion of human regulatory T-cells from patients with type 1 diabetes

Amy L Putnam et al. Diabetes. 2009 Mar.

Abstract

Objective: Regulatory T-cells (Tregs) have catalyzed the field of immune regulation. However, translating Treg-based therapies from animal models of autoimmunity to human clinical trials requires robust methods for the isolation and expansion of these cells-a need forming the basis for these studies.

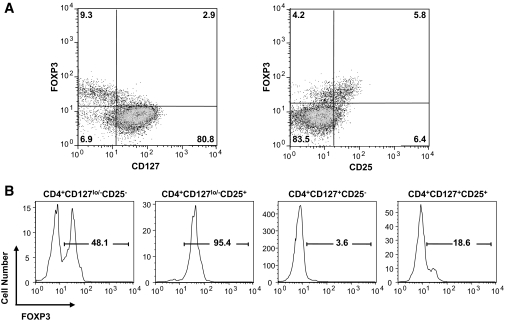
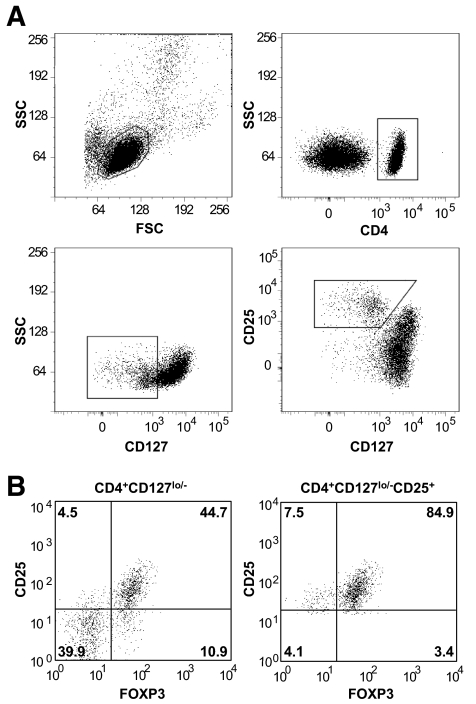
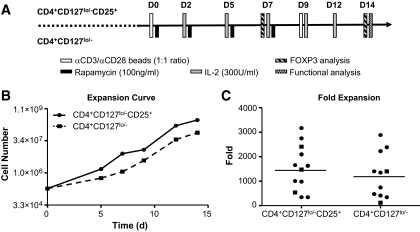
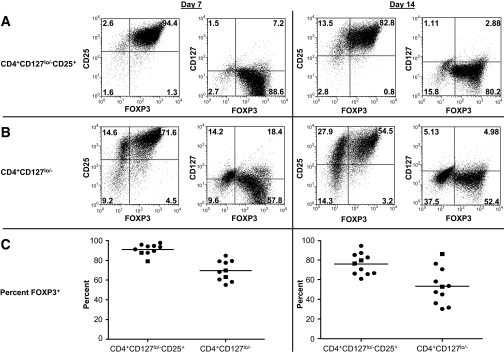
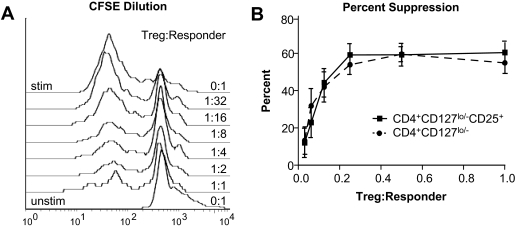
Research design and methods: Tregs from recent-onset type 1 diabetic patients and healthy control subjects were isolated by fluorescence-activated cell sorting and compared for their capacity to expand in vitro in response to anti-CD3-anti-CD28-coated microbeads and IL-2. Expanded cells were examined for suppressive function, lineage markers and FOXP3, and cytokine production.

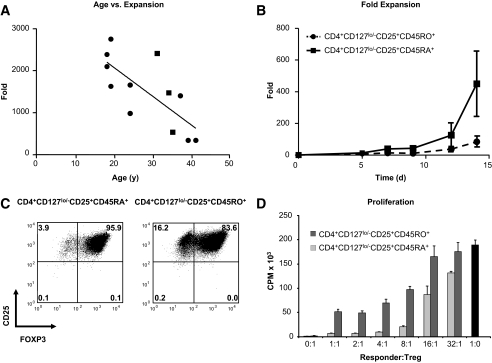
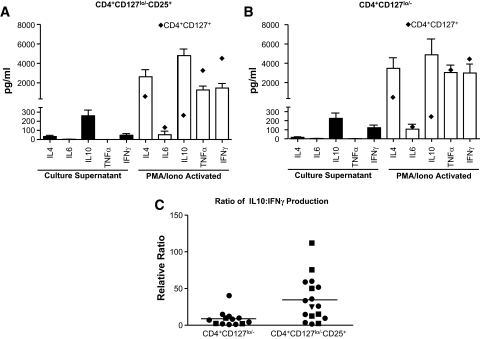
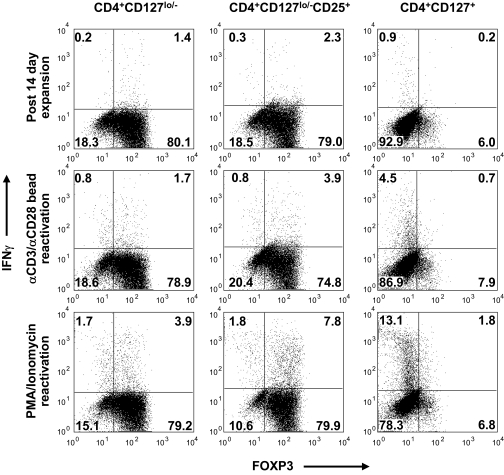
Results: Both CD4+CD127(lo/-) and CD4+CD127(lo/-)CD25+ T-cells could be expanded and used as Tregs. However, expansion of CD4+CD127(lo/-) cells required the addition of rapamycin to maintain lineage purity. In contrast, expansion of CD4+CD127(lo/-)CD25+ T-cells, especially the CD45RA+ subset, resulted in high yield, functional Tregs that maintained higher FOXP3 expression in the absence of rapamycin. Tregs from type 1 diabetic patients and control subjects expanded similarly and were equally capable of suppressing T-cell proliferation. Regulatory cytokines were produced by Tregs after culture; however, a portion of FOXP3+ cells were capable of producing interferon (IFN)-gamma after reactivation. IFN-gamma production was observed from both CD45RO+ and CD45RA+ Treg populations.

Conclusions: The results support the feasibility of isolating Tregs for in vitro expansion. Based on expansion capacity, FOXP3 stability, and functional properties, the CD4+CD127(lo/-)CD25+ T-cells represent a viable cell population for cellular therapy in this autoimmune disease.


Figures

FIG. 1.
FIG. 1.
CD4, CD25, and CD127 identify FOXP3+ Tregs in human peripheral blood. A: CD127 expression inversely correlates with FOXP3 expression in freshly isolated human peripheral blood CD4+ T-cells (left plot), whereas CD25 expression is positively correlated with FOXP3 expression (right plot). B: Using the combination of these markers, the highest purity of FOXP3+ T-cells is found within the CD4+CD127lo/−CD25+ T-cell fraction (∼95%). One representative sample is shown. (A three-dimensional plot and animated rotations showing Treg and Teff staining are shown in Supplemental Fig. 1 and supplemental videos.)
FIG. 2.
FIG. 2.
Gating strategy and FOXP3 analysis of freshly isolated CD4+CD127lo/− and CD4+CD127lo/−CD25+ T-cells. A: Tregs were isolated from peripheral blood through a FACS-based sorting procedure. The lymphocyte population was gated based on forward and side scatter (A, upper-left plot), followed by gating all CD4+ T-cells (A, upper-right plot). The two cell populations were then sorted based on CD127lo/− and CD25+ expression (A; CD4+CD127lo/− T-cells, middle-left plot, gated population, or CD4+CD127lo/−CD25+ T-cells, middle-right plot, gated population). B: FOXP3 expression from one representative sample is shown for freshly isolated CD4+CD127lo/− (left plot) and CD4+CD127lo/−CD25+ T-cells (right plot).
FIG. 3.
FIG. 3.
CD4+CD127lo/−CD25+ and CD4+CD127lo/− T-cells can be expanded to comparable levels. A: The diagram outlines the time points and procedures conducted for each cell population during the in vitro expansion period. Freshly sorted Tregs were activated with anti-CD3/anti-CD28–coated microbeads in the presence of exogenous IL-2 over a 14-day culture period. No immunosuppressive reagents were used in CD4+CD127lo/−CD25+ T-cell expansions, whereas CD4+CD127lo/− T-cells were grown in the presence of rapamycin (100 ng/ml) for the first 7 days of culture. B: A representative expansion curve is shown for CD4+CD127lo/−CD25+ T-cells (solid line) and CD4+CD127lo/− T-cells (dashed line). C: Tregs from a total of 12 individuals (nine recent-onset type 1 diabetes subjects [circles] and three nondiabetic healthy control subjects [squares]) were sorted and expanded. Fold expansion data are shown at the 14-day time point, with the mean indicated for CD4+CD127lo/−CD25+ T-cells (1,532-fold) and CD4+CD127lo/− T-cells (1,248-fold).
FIG. 4.
FIG. 4.
Subject age and the proportion of naïve and memory T-cells influence the expansion potential and purity of Tregs. A: Spearman rank analysis indicates a negative correlation between subject age and fold expansion of CD4+CD127lo/−CD25+ Tregs at the 14-day time point (r = −0.77, P = 0.0033). B: CD4+CD127lo/−CD25+ Tregs were sorted into CD45RA+ (solid line) and CD45RO+ (dashed line) cell fractions and expanded as previously described. Expansion time-course data indicate a trend toward increased expansion of naïve compared with memory T-cell fractions (mean 317.0- vs. 59.7-fold, respectively, n = 3). C: CD45RA+ Tregs (left plot) display increased FOXP3 purity at the 14-day time point versus CD45RO+ Tregs (right plot). D: The suppression capacity of expanded CD45RA+ and CD45RO+ Tregs were compared at varying ratios of Treg to anti-CD3–and anti-CD28–stimulated PBMC responders. Results are shown as average counts per minute (CPM) of triplicates measured by the incorporation of 3H-thymidine in co-cultures and compared with responders alone (▪). C and D indicate data from one representative sample.
FIG. 5.
FIG. 5.
Human Tregs retain FOXP3 expression after expansion. A: Flow cytometric plots from a representative sample showing CD25, CD127, and FOXP3 expression for CD4+CD127lo/−CD25+ T-cells (top panels) and CD4+CD127lo/− T-cells (B, middle panels). Data from days 7 and 14 of expansion are indicated (left-hand and right-hand panels, respectively). C: Individual FOXP3 percentages 7-day (left plot) and 14-day (right plot) time points from type 1 diabetic subjects (circles) and control subjects (squares) are graphed with the mean for each group indicated.
FIG. 6.
FIG. 6.
Expanded Tregs retain their suppressive function after in vitro expansion. A: The plot shows a representative suppression assay using CFSE-labeled PBMCs (responders) incubated with titrating levels of CD4+CD127lo/−CD25+ Tregs. The top histogram indicates CFSE dilution of CD8+-gated responder T-cells alone that divided in response to soluble anti-CD3 and anti-CD28 over a 4-day culture period. The bottom histogram indicates the initial CFSE fluorescence peak of unstimulated responders alone with overlaid histograms showing the proliferation of responders at increasing ratios of Tregs to responders indicated (right y-axis). B: In vitro suppression from CD4+CD127lo/−CD25+ Tregs (solid lines) and CD4+CD127lo/− Tregs (dashed lines) are dose responsive. Data shown indicate the percent suppression plotted as means ± SE of for all 12 study subjects at each ratio of Treg to responder cells.
FIG. 7.
FIG. 7.
Cytokine production profiles of in vitro expanded Tregs. A: Culture supernatants were collected from 14-day expansion cultures (▪) of CD4+CD127lo/−CD25+ T-cells and analyzed for the production of cytokines by cytometric bead array. In addition, expanded cells (1 × 10⁶) were restimulated with PMA/ionomycin in vitro for 5 h and supernatants were collected for analysis (□). ♦, levels of cytokine detected from similarly expanded CD4+CD127+ T effector cells. Cytokine data are graphed as the means + SE for all 12 study subjects. C: Data indicate the relative ratio of IL-10/IFN-γ production from expanded CD4+CD127lo/− (left) and CD4+CD127lo/−CD25+ (right) Treg populations after 5 h reactivation with PMA/ionomycin (n = 12, 8.8 vs. 34.6, P = 0.0014).
FIG. 8.
FIG. 8.
Expanded FOXP3+ T-cells are capable of producing IFN-γ after reactivation. CD4+CD127lo/− (left plots), CD4+CD127lo/−CD25+ (middle plots), and CD4+CD127+ T-cells (right plots) were stained for intracellular FOXP3 and IFN-γ. For each cell population, a dose-responsive increase in IFN-γ production was observed in cells after in vitro expansion. Plots indicate flow cytometric data from one representative subject stained immediately after a 14-day culture period (upper panels), or after an additional 5 h reactivation period with anti-CD3 and anti-CD28 microbeads (middle panels), or PMA/ionomycin (lower panels).

References

    1. Atkinson MA, Eisenbarth GS: Type 1 diabetes: new perspectives on disease pathogenesis and treatment. Lancet 358: 221–229, 2001 - PubMed
    1. Chatenoud L, Salomon B, Bluestone JA: Suppressor T cells: they're back and critical for regulation of autoimmunity! Immunol Rev 182: 149–163, 2001 - PubMed
    1. Serreze DV, Chapman HD, Varnum DS, Hanson MS, Reifsnyder PC, Richard SD, Fleming SA, Leiter EH, Shultz LD: B lymphocytes are essential for the initiation of T cell-mediated autoimmune diabetes: analysis of a new “speed congenic” stock of NOD. Ig mu null mice. J Exp Med 184: 2049–2053, 1996 - PMC - PubMed
    1. Fontenot JD, Rudensky AY: Molecular aspects of regulatory T cell development. Semin Immunol 16: 73–80, 2004 - PubMed
    1. Salomon B, Lenschow DJ, Rhee L, Ashourian N, Singh B, Sharpe A, Bluestone JA: B7/CD28 costimulation is essential for the homeostasis of the CD4+CD25+ immunoregulatory T cells that control autoimmune diabetes. Immunity 12: 431–440, 2000 - PubMed

Publication types

MeSH terms