. 2008 Dec 23;105(51):20350-5.
doi: 10.1073/pnas.0803375105. Epub 2008 Dec 15.

Climate regulation of fire emissions and deforestation in equatorial Asia

Affiliations

Climate regulation of fire emissions and deforestation in equatorial Asia

G R van der Werf et al. Proc Natl Acad Sci U S A. .

Abstract

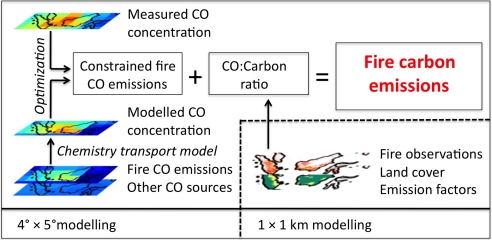
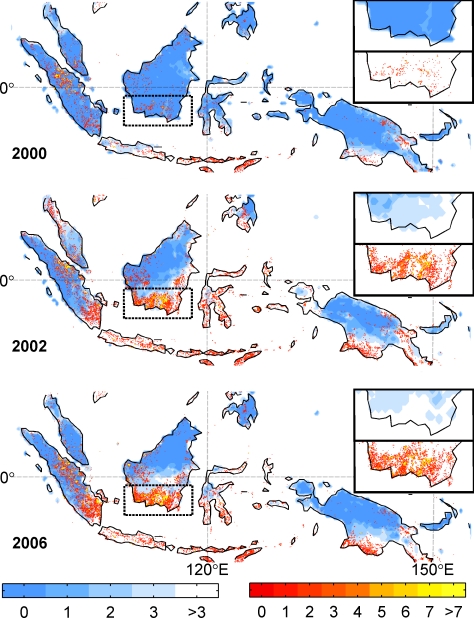
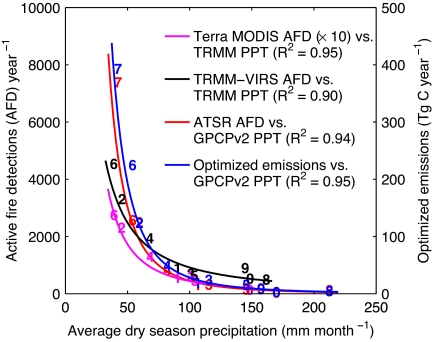
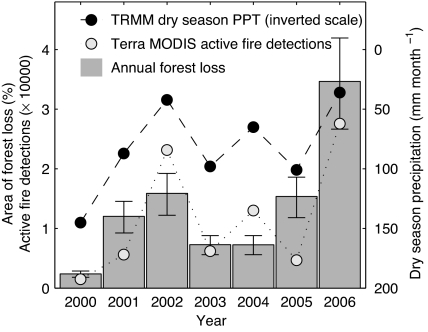
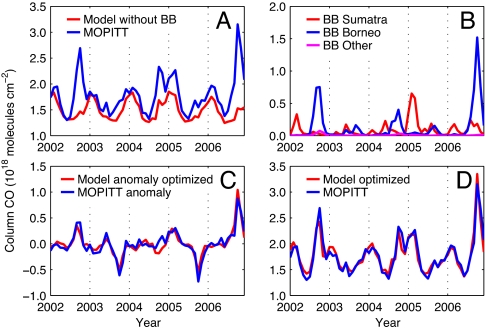
Drainage of peatlands and deforestation have led to large-scale fires in equatorial Asia, affecting regional air quality and global concentrations of greenhouse gases. Here we used several sources of satellite data with biogeochemical and atmospheric modeling to better understand and constrain fire emissions from Indonesia, Malaysia, and Papua New Guinea during 2000-2006. We found that average fire emissions from this region [128 +/- 51 (1sigma) Tg carbon (C) year(-1), T = 10(12)] were comparable to fossil fuel emissions. In Borneo, carbon emissions from fires were highly variable, fluxes during the moderate 2006 El Niño more than 30 times greater than those during the 2000 La Niña (and with a 2000-2006 mean of 74 +/- 33 Tg C yr(-1)). Higher rates of forest loss and larger areas of peatland becoming vulnerable to fire in drought years caused a strong nonlinear relation between drought and fire emissions in southern Borneo. Fire emissions from Sumatra showed a positive linear trend, increasing at a rate of 8 Tg C year(-2) (approximately doubling during 2000-2006). These results highlight the importance of including deforestation in future climate agreements. They also imply that land manager responses to expected shifts in tropical precipitation may critically determine the strength of climate-carbon cycle feedbacks during the 21st century.


Conflict of interest statement

The authors declare no conflict of interest.

Figures

Fig. 1.
Fig. 1.
Schematic overview of the methodology and data sets used to estimate constrained fire carbon emissions. Initial fire CO emissions estimates were available on 1° × 1° resolution while the GEOS-Chem model operated on 4° × 5°, also the resolution to which the measured CO mixing ratios from MOPITT were resampled.
Fig. 2.
Fig. 2.
Dry season length (14) and fire detections (20) for the strong 2000 La Niña and 2002 and 2006 moderate El Niño years. The southern Borneo region is boxed and the dry season length and number of fire detections for this study region are shown in separate insets. The length of the dry season is given as number of months with <100 mm month−1 precipitation (Fig. S2, blue-white) and the number of detected fires each year is shown in red–yellow.
Fig. 3.
Fig. 3.
Relation between average precipitation rates during peak fire season and satellite-derived active fire detections (AFD). Optimized emissions for southern Borneo (south of 1°S), the region most impacted by ENSO-induced interannual variability in precipitation rates, are also shown. Because of variability in the timing of the dry season, here we defined average dry season precipitation as the mean monthly precipitation during the 3 consecutive months with lowest rainfall. The numbers in the graph denote the year (7 = 1997, 0 = 2000, 1 = 2001, etc., through 6 = 2006); correlation coefficients are based on a power fit. Data sources include TRMM (14) and Global Precipitation Climatology Project version 2 (GPCPv2) (36) for precipitation and TRMM-Visible Infrared Scanner (VIRS) (37), (Advanced) Along Track Scanning Radiometer (A)ATSR (38), and Terra-MODIS (20) for active fire detections. Differences in precipitation rates between GPCPv2 (2.5° × 2.5°) and TRMM (0.25° × 0.25°) are caused, in part, by differences in spatial resolution. The large fires in early 1998 in eastern Borneo burned outside this study region.
Fig. 4.
Fig. 4.
Interannual rate of forest loss in southern Borneo (south of 1°S) shown as percentage of area with >50% woody cover in 2000 (33), average dry season precipitation based on TRMM precipitation (14), and Terra-MODIS active fire detections (20). Error bars on forest loss rates indicate the omission errors (positive) and commission errors (negative).
Fig. 5.
Fig. 5.
Comparisons of modeled (Model) and measured (MOPITT) monthly average CO column mixing ratios for a box covering the region 12°N–12°S and 57.5°E–147.5°E. (a) Modeled CO from the burning of fossil and biofuel, CH4 and VOC oxidation, and biomass burning (BB) from regions outside the equatorial Asia region are compared with measured CO, indicating that without fires from equatorial Asia the atmospheric measurements cannot be reproduced. (b) CO originating from BB in Sumatra, Borneo, and other regions of equatorial Asia as calculated by our bottom-up model. (c) Optimized modeled biomass burning sources and MOPITT anomalies based on a scalar of 0.57 for Sumatra and 1.01 for Borneo, which is used in the main text in combination with the bottom-up modeled mean emissions. (d) Optimized sources using scalars for Sumatra fires [0.24] and Borneo fires [1.10], and one scalar for all other sources combined [1.10], and MOPITT measurements (the absolute optimization approach described in Materials and Methods).

References

    1. Page SE, et al. A record of Late Pleistocene and Holocene carbon accumulation and climate change from an equatorial peat bog (Kalimantan, Indonesia): implications for past, present and future carbon dynamics. J Quat Sci. 2004;19:625–635.
    1. Rieley JO, Ahmad-Shah AA, Brady MA. In: Proceedings of a Workshop on Integrated Planning and Management of Tropical Lowland Peatlands. Maltby E, Immirzi CP, Safford RJ, editors. Cambridge, UK: IUCN; 1996. pp. 17–53.
    1. Immirzi CP, Maltby E, Clymo RS. A Report for Friends of the Earth by the Wetland Ecosystems Research Group. Exeter, UK: Department of Geography, University of Exeter; 1992. pp. 1–145.
    1. Page SE, et al. The amount of carbon released from peat and forest fires in Indonesia during 1997. Nature. 2002;420:61–65. - PubMed
    1. Hooijer A, Silvius M, Wösten H, Page S. PEAT-CO2: assessment of CO2 emissions from drained peatlands in SE Asia. The Netherlands: Delft Hydraulics, Delft; 2006. report Q3943.

Publication types

Substances

LinkOut - more resources