. 2008 Dec 23;105(51):20173-8.
doi: 10.1073/pnas.0806355106. Epub 2008 Dec 15.

Integrated microfluidic bioprocessor for single-cell gene expression analysis

Affiliations

Integrated microfluidic bioprocessor for single-cell gene expression analysis

Nicholas M Toriello et al. Proc Natl Acad Sci U S A. .

Abstract

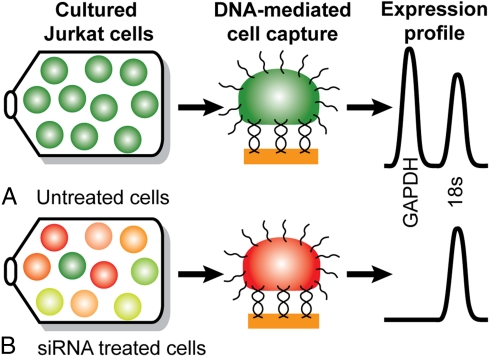
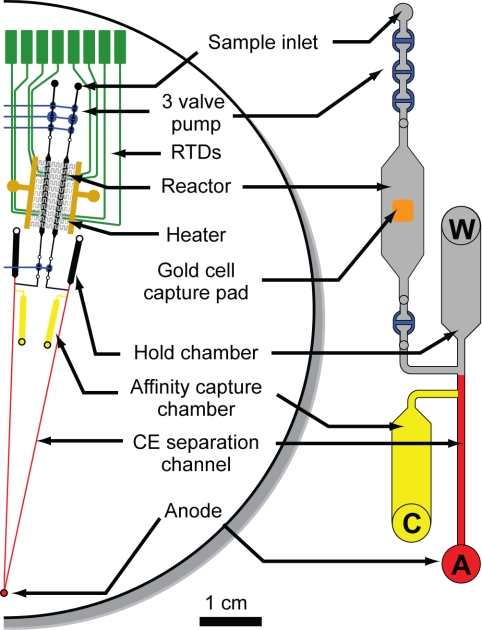
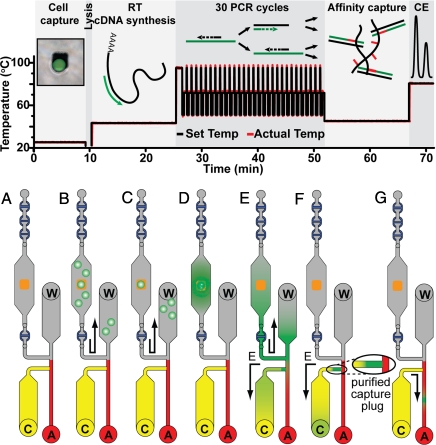
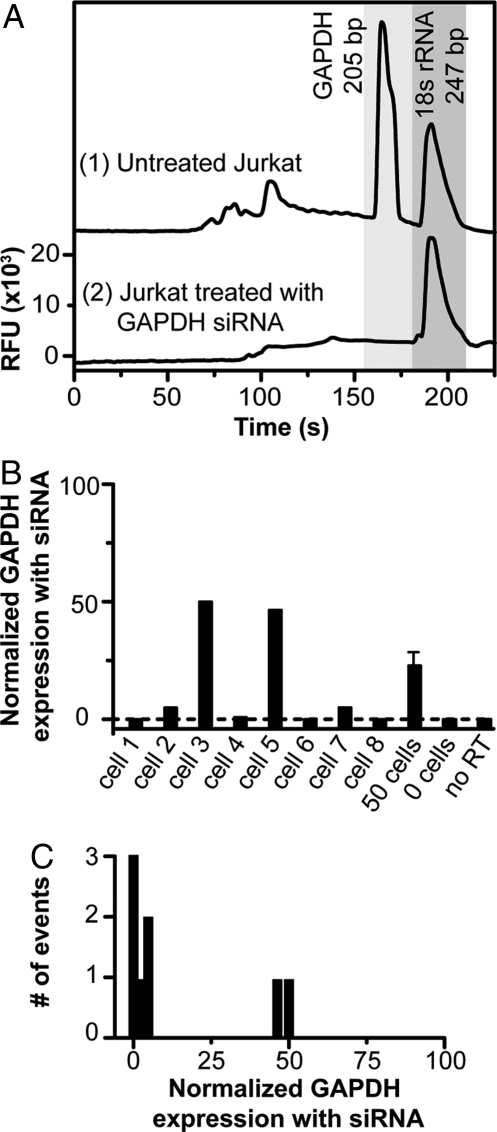
An integrated microdevice is developed for the analysis of gene expression in single cells. The system captures a single cell, transcribes and amplifies the mRNA, and quantitatively analyzes the products of interest. The key components of the microdevice include integrated nanoliter metering pumps, a 200-nL RT-PCR reactor with a single-cell capture pad, and an affinity capture matrix for the purification and concentration of products that is coupled to a microfabricated capillary electrophoresis separation channel for product analysis. Efficient microchip integration of these processes enables the sensitive and quantitative examination of gene expression variation at the single-cell level. This microdevice is used to measure siRNA knockdown of the GAPDH gene in individual Jurkat cells. Single-cell measurements suggests the presence of 2 distinct populations of cells with moderate (approximately 50%) or complete (approximately 0%) silencing. This stochastic variation in gene expression and silencing within single cells is masked by conventional bulk measurements.


Conflict of interest statement

Conflict of interest statement: R.A.M. has a financial interest in Microchip Biotechnologies, Inc., which is commercially developing aspects of the technologies presented here.

Figures

Fig. 1.
Fig. 1.
Overview of single-cell gene silencing assay. Jurkat cells are cultured and surface-labeled, a single cell is captured on a target pad via DNA duplex formation, and an RT-PCR expression profile is generated. (A) Cells under normal growth conditions exhibit homogenous high expression of GAPDH (green cells) compared with a control 18S rRNA. (B) Cells treated with siRNA directed at GAPDH exhibit varying levels of mRNA knockdown.
Fig. 2.
Fig. 2.
Microfluidic device layout. Schematic showing half of the device (2 of the 4 complete systems) for single-cell gene expression profiling. The 4-layer glass–PDMS–glass–glass microdevice contains 4 distinct regions. The first region at the top is a 3-valve pump. The reactor region consists of a photolithographically defined gold cell-capture pad in the center of a 200-nL reaction chamber along with RTDs and a microfabricated heater for thermal cycling. The affinity capture region comprises a hold chamber and an affinity capture chamber (yellow). Finally, the thermally released amplicons are analyzed on the CE separation channel (red). Each device contains 4 independently addressable systems enabling the analysis of 4 single cells in parallel. All channels are etched to a depth of 20 μm.
Fig. 3.
Fig. 3.
Schematic of the biochemical steps performed in the integrated gene expression microdevice. (Upper) The analysis is complete in <75 min. (Lower) (A) Depiction of the operation of the single-cell gene expression microsystem. (B) First, cells functionalized with a 20-base oligonucleotide on their cell membrane are flowed into the reactor. (C) A single cell is captured on a size-limiting 25- × 25-μm2 gold pad when the ssDNA on its exterior binds to the complementary capture strand immobilized on the gold pad. (D) The immobilized cell is freeze–thaw lysed, and mRNA is reverse-transcribed into a stable cDNA strand (15 min). PCR amplification (30 cycles) is completed in 25 min. (E) Amplified fragments and unreacted RT-PCR mixture are pumped from the reactor into the hold chamber and electrophoretically driven from the waste (W) to the cathode (C) reservoirs. (F) Fragments of interest with complementarity to the affinity capture probe are concentrated and immobilized at the entrance of the capture chamber creating a purified capture plug. (G) Finally, the products are thermally released at 80 °C from the affinity capture gel and electrophoretically separated as they migrate toward the anode (A). Fluorescently labeled amplicons are detected by confocal fluorescence to determine their amount and identity.
Fig. 4.
Fig. 4.
Gene expression and silencing at the single-cell level. (A) Representative gene expression electropherograms from individual Jurkat cells (1). A single wild-type cell with primers targeting GAPDH (200 bp) and 18S rRNA (247 bp) generates 2 strong peaks migrating at 160 s and 185 s, respectively (2). A single cell electroporated with siRNA directed at GAPDH mRNA shows only a single peak for 18S rRNA. (B) Gene expression of GAPDH for Jurkat cells treated with GAPDH siRNA relative to normal untreated cells. GAPDH expression has been normalized to a control 18S rRNA for comparison. Experiments from 8 individual cells show GAPDH mRNA levels at 0, 5, 50, 1, 48, 0, 5, and 0% of normally untreated Jurkat cells. However, a representative bulk measurement from 50 cells shows GAPDH expression at 21 ± 4%. When no cell is captured on the pad there is no amplification. Similarly, a PCR control with no reverse transcriptase shows no amplification. (C) Histogram of the number of events for siRNA treated cells shows that there are 2 distinct populations of cells whose expression levels are very distinct from the population average.

References

    1. Schena M, Shalon D, Davis RW, Brown PO. Quantitative monitoring of gene expression patterns with a complementary DNA microarray. Science. 1995;270:467–470. - PubMed
    1. Velculescu VE, Zhang L, Vogelstein B, Kinzler KW. Serial analysis of gene expression. Science. 1995;270:484–487. - PubMed
    1. Levsky JM, Shenoy SM, Pezo RC, Singer RH. Single-cell gene expression profiling. Science. 2002;297:836–840. - PubMed
    1. Elowitz MB, Levine AJ, Siggia ED, Swain PS. Stochastic gene expression in a single cell. Science. 2002;297:1183–1186. - PubMed
    1. Shav-Tal Y, et al. Dynamics of single mRNPs in nuclei of living cells. Science. 2004;304:1797–1800. - PMC - PubMed

Publication types