. 2008 Dec 22;205(13):3187-99.
doi: 10.1084/jem.20080718. Epub 2008 Dec 15.

Positive regulation of plasmacytoid dendritic cell function via Ly49Q recognition of class I MHC

Affiliations

Positive regulation of plasmacytoid dendritic cell function via Ly49Q recognition of class I MHC

Lee-Hwa Tai et al. J Exp Med. .

Abstract

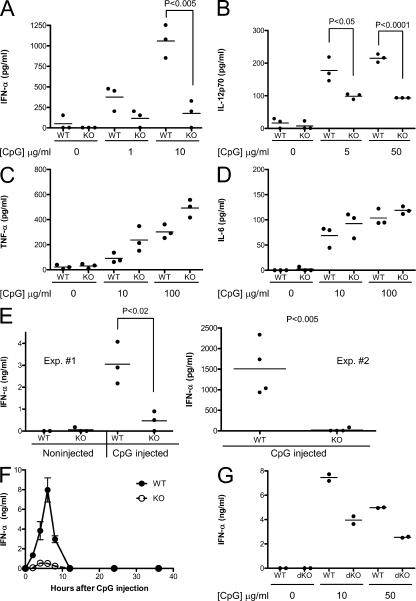
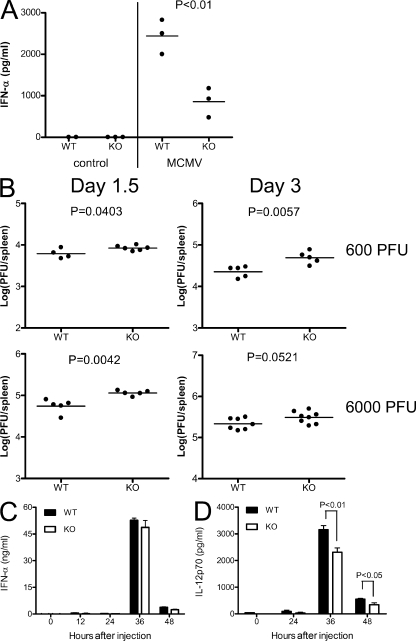
Plasmacytoid dendritic cells (pDCs) are an important source of type I interferon (IFN) during initial immune responses to viral infections. In mice, pDCs are uniquely characterized by high-level expression of Ly49Q, a C-type lectin-like receptor specific for class I major histocompatibility complex (MHC) molecules. Despite having a cytoplasmic immunoreceptor tyrosine-based inhibitory motif, Ly49Q was found to enhance pDC function in vitro, as pDC cytokine production in response to the Toll-like receptor (TLR) 9 agonist CpG-oligonucleotide (ODN) could be blocked using soluble monoclonal antibody (mAb) to Ly49Q or H-2K(b). Conversely, CpG-ODN-dependent IFN-alpha production by pDCs was greatly augmented upon receptor cross-linking using immobilized anti-Ly49Q mAb or recombinant H-2K(b) ligand. Accordingly, Ly49Q-deficient pDCs displayed a severely reduced capacity to produce cytokines in response to TLR7 and TLR9 stimulation both in vitro and in vivo. Finally, TLR9-dependent antiviral responses were compromised in Ly49Q-null mice infected with mouse cytomegalovirus. Thus, class I MHC recognition by Ly49Q on pDCs is necessary for optimal activation of innate immune responses in vivo.


Figures

Figure 1.
Figure 1.
Ly49Q–H-2Kb interactions are necessary for pDC cytokine secretion after TLR9 stimulation. (A and B) Splenic pDCs from 129S1 mice were isolated using mPDCA-1 microbeads and cultured overnight in the presence or absence of CpG-ODN and the indicated mAb. The supernatant was assayed by ELISA for IFN-α (A) or IL-12p70 (B). (C–E) Splenic pDCs from B6 (C and D) or 129S1 (E) mice were isolated with mPDCA-1 microbeads and cultured overnight in wells that had been precoated with the indicated mAb or recombinant MHC molecule in the presence or absence of 10 μg/ml CpG. The supernatant was assayed by ELISA for IFN-α. Isotype control antibodies for anti-Ly49Q, anti–H-2Kb, and Kb:Ig/OVA are rIgG2a, mIgG2a, and mIgG1, respectively. Anti-Ly49Q mAb 2E6 was used for these experiments. Data are presented as the mean of triplicate samples (error bars = SD). Results are representative of at least three independent experiments. ND, not detectable.
Figure 2.
Figure 2.
Generation of Ly49Q-null mice. (A) Ly49q1 gene disruption strategy. A 10-kb segment encompassing exons 1–4 was cloned by recombineering from BAC DNA, and a floxed PGK-Neor (neor) cassette was inserted into exon 2. After electroporation and selection, an ES clone possessing the predicted KpnI (K) fragment, as verified by Southern blotting, was electroporated with CMV-Cre plasmid, and the deletion of PGK-Neor was confirmed by PCR. Both Ly49q1neo and Ly49q1lox mice were created. PCR primers are shown by arrowheads. Boxes denote exons, and the location of the Southern probe is underlined. (B) Southern blot analysis. Genomic tail DNA of pups from Ly49q1neo/wt parent mice was digested with KpnI and analyzed by Southern blotting with the probe depicted in A. Note that the probe detects identical fragments from Ly49q1, q2, and q3 genes. (C) PCR analysis of tail DNA from mice in B. To eliminate confusion caused by Ly49q2 and q3 genes, Ly49q1-specific primers were designed. These primers were used to analyze tail DNA by PCR and to differentiate between Ly49q1wt and Ly49q1neo alleles. (D) PCR analysis of pups from Ly49q1lox/wt parent mice. Tail DNA was PCR amplified with primers flanking exon 2 to differentiate Ly49q1wt and Ly49q1lox alleles. (E) Lack of Ly49Q protein on DCs derived from Ly49Q-null mice. Ly49Q-null and -WT splenocytes were stained with a combination of mAb to CD11c/B220 (top) or Siglec-H/BST2 (bottom), and Ly49Q-specific mAb NS-34 or an isotype control. Ly49Q mAb staining intensity relative to isotype control mAb on gated cells is shown.
Figure 3.
Figure 3.
Age-dependent increase in pDC proportion in Ly49Q-null mice. (A) pDC size and morphology. pDCs were sorted as CD11c+B220+CD11bDX5CD3CD19 cells from the spleen and cytocentrifuged on microspcope slides directly as resting pDCs or after incubation with 3 μg/ml CpG for 16 h. Slides were then stained with Giemsa solution. Bar, 5 μm. (B) Localization of splenic pDCs. Sections of spleen isolated from untreated young mice or mice injected i.v. with 10 μg/ml CpG 24 h earlier were stained with fluorescently labeled mAb to CD19 (B cells; green), CD3 (T cells; blue), and BST2 (pDCs; red). Bar, 50 μm. (C) Frequency of pDCs in primary and secondary lymphoid organs. Shown are the proportion of pDCs defined as CD11c+Siglec-H+ cells in lymphoid organs of Ly49q+/+ (closed bars) and Ly49qlox/lox (open bars) mice (6 wk old, n = 3; 9 mo old, n = 6). A similar pattern was observed with BST2 staining (not depicted). Data are presented as the mean of individual mice (error bars = SD). Results are representative of at least three independent experiments, except for C (9-mo-old mice), which was done twice.
Figure 4.
Figure 4.
Ly49Q-null pDCs display an IFN-α production defect in response to CpG-ODN. (A–D) IFN-α production by isolated pDCs after CpG-ODN stimulation. pDCs were isolated with mPDCA-1 microbeads from Ly49Q-null and -WT mice and cultured overnight in the presence of the indicated concentrations of CpG-ODN. Culture supernatants were assayed by ELISA for IFN-α (A), IL-12p70 (B), TNF-α (C), or IL-6 (D). (E) Induction of serum cytokines by CpG-ODN injection. Ly49Q-null and -WT littermates were injected with CpG-ODN + DOTAP, and blood samples were taken after 6 h for IFN-α ELISA. Uninjected mice served as controls. Each symbol represents a single mouse. (F) Serum IFN-α time course after CpG-ODN stimulation. Ly49Q-null and -WT littermates were injected with CpG-ODN + DOTAP, and blood was collected periodically over 36 h. Serum IFN-α levels were deduced by ELISA from three mice of each genotype for each time point. Data are representative of experiments done at least three times independently (error bars = SD). (G) pDCs were isolated from H-2KbDb–null or –WT (B6) mice and treated as in A. Horizontal bars represent means.
Figure 5.
Figure 5.
Ly49Q binds to H-2Kb in cis. (A) pDCs were isolated from the spleens of mice with the indicated genotypes with mPDCA-1 microbeads. Isolated pDCs were stained with PE–H-2Kb/OVA tetramer and allophycocyanin–anti-BST2 mAb and were analyzed by flow cytometry. Cells are gated on pDCs. The percentage of cells positively staining with PE–H-2Kb/OVA is shown. (B) Ly49Q levels on MHC-deficient pDCs. Splenocytes from the indicated strains (WT is B6) were stained for BST2, Siglec-H, and Ly49Q (NS34). The level of Ly49Q expression on BST2+Siglec-H+ cells is shown (shaded histogram). The open histogram represents the secondary reagent alone.
Figure 6.
Figure 6.
Normal TLR9 and CD86 expression by Ly49Q-null pDCs. (A) Splenocytes from Ly49Q-null and -WT mice were stained for Siglec-H and BST2, and were then permeabilized and stained for intracellular TLR9 or with an isotype control mAb. TLR9 (shaded histogram) or control (open histogram) expression on Siglec-H+BST2+ cells is shown. (B) In vivo activation of pDCs by CpG-ODN. Ly49Q-null and -WT littermates were injected with CpG-ODN + DOTAP. Uninjected mice served as controls. After 6 h, the splenocytes were isolated and stained for Siglec-H, BST2, and CD86, and were analyzed by flow cytometry. The percentage of CD86+ pDCs after 6 h is shown (error bars = SD). (C) In vitro activation of pDCs by CpG-ODN. pDCs from Ly49Q-null and -WT mice were isolated with mPDCA-1 microbeads and cultured overnight in the presence of the indicated concentrations of CpG-ODN. The following day, the CD11c+B220+ cells were analyzed by flow cytometry for CD86 surface expression. MFI (left) and the percentage of positive cells (right) are shown as the means of triplicate cultures ± SD. Data are representative of at least three independent experiments.
Figure 7.
Figure 7.
TLR7-induced cytokine production is defective in Ly49Q-null pDCs. (A and B) In vitro activation of pDCs by influenza virus. pDCs from Ly49Q-null and -WT mice were isolated using mPDCA-1 microbeads and cultured overnight in the presence or absence of 20 hemagglutinin units of influenza virus. Culture supernatants were assayed by ELISA for IFN-α (A) or IL-12p70 (B). Each symbol represents a single mouse. Horizontal bars represent means. (C) In vitro activation of pDCs by imiquimod. pDCs from Ly49Q-null and -WT mice were isolated using mPDCA-1 microbeads and cultured overnight with the indicated concentrations of imiquimod. The following day, CD11c+B220+ cells were stained with FITC–anti-CD86 and analyzed by flow cytometry for CD86 surface expression. MFI (left) and the percentage of positive cells (right) are shown as the means of triplicate cultures ± SD. Data are representative of at least three independent experiments.
Figure 8.
Figure 8.
Reduced anti-MCMV responses by Ly49Q-null mice. (A) Decreased MCMV-induced IFN-α secretion by pDCs in vitro. Splenic pDCs were isolated with mPDCA-1 microbeads and cultured overnight in the presence of 200 PFU/ml of MCMV. Supernatants were harvested the following day. Supernatants were assayed for IFN-α levels by ELISA. (B) Greater MCMV proliferation in Ly49Q-null mice. Ly49Q-null and -WT mice were challenged with 600 or 6,000 PFU MCMV. After 1.5 or 3 d, spleens were harvested and viral titer was determined using BALB/c mouse embryo fibroblasts. Each symbol represents a single mouse. Data are representative of at least three independent experiments. Horizontal bars represent means. (C and D) Littermates of the indicated genotypes were infected with 6,000 PFU MCMV i.p., and serum samples were taken at the indicated time points after infection. IFN-α (C) or IL-12p70 (D) levels were determined by ELISA (n = 4 per time point). The means of individual mice ± SD are shown.

References

    1. Liu, Y.J. 2005. IPC: professional type 1 interferon-producing cells and plasmacytoid dendritic cell precursors. Annu. Rev. Immunol. 23:275–306. - PubMed
    1. Facchetti, F., C. Wolf-Peeters, D.Y. Mason, K. Pulford, J.J. van den Oord, and V.J. Desmet. 1988. Plasmacytoid T cells. Immunohistochemical evidence for their monocyte/macrophage origin. Am. J. Pathol. 133:15–21. - PMC - PubMed
    1. Abb, J., H. Abb, and F. Deinhardt. 1984. Relationship between natural killer (NK) cells and interferon (IFN) alpha-producing cells in human peripheral blood. Studies with a monoclonal antibody with specificity for human natural killer cells. Immunobiology. 167:359–364. - PubMed
    1. Perussia, B., V. Fanning, and G. Trinchieri. 1985. A leukocyte subset bearing HLA-DR antigens is responsible for in vitro alpha interferon production in response to viruses. Nat. Immun. Cell Growth Regul. 4:120–137. - PubMed
    1. Kadowaki, N., S. Ho, S. Antonenko, R.W. Malefyt, R.A. Kastelein, F. Bazan, and Y.J. Liu. 2001. Subsets of human dendritic cell precursors express different Toll-like receptors and respond to different microbial antigens. J. Exp. Med. 194:863–869. - PMC - PubMed

Publication types

MeSH terms