. 2008 Dec 22;205(13):2975-84.
doi: 10.1084/jem.20081800. Epub 2008 Dec 15.

Dysregulation of lipid and amino acid metabolism precedes islet autoimmunity in children who later progress to type 1 diabetes

Affiliations

Dysregulation of lipid and amino acid metabolism precedes islet autoimmunity in children who later progress to type 1 diabetes

Matej Oresic et al. J Exp Med. .

Abstract

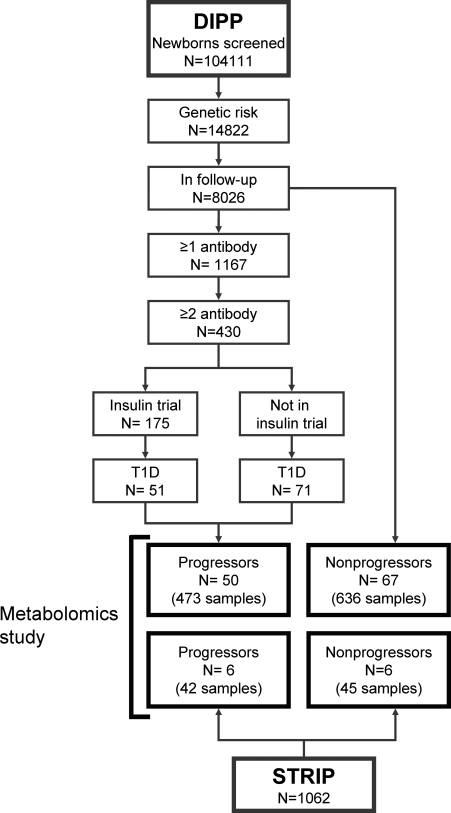
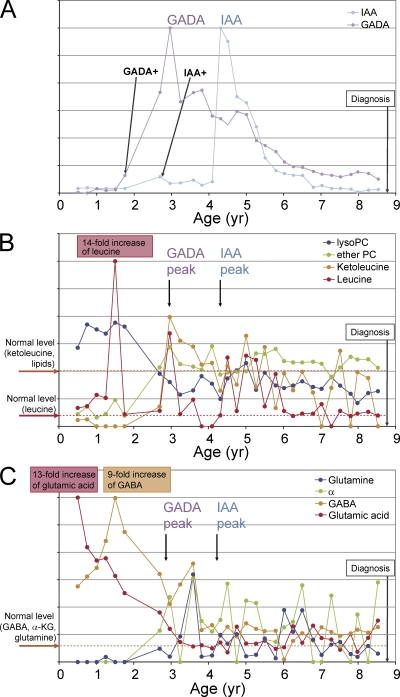
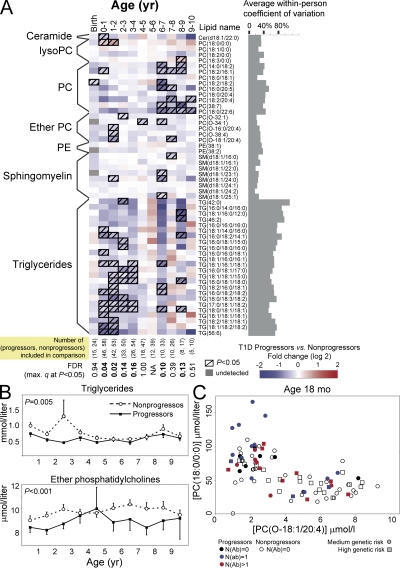
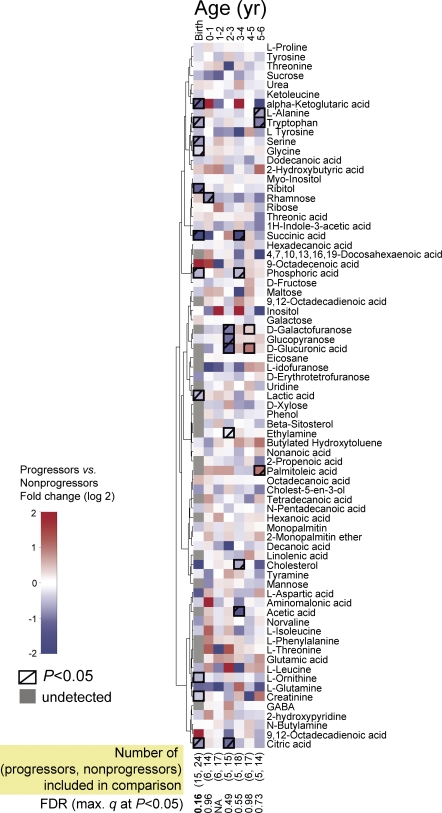
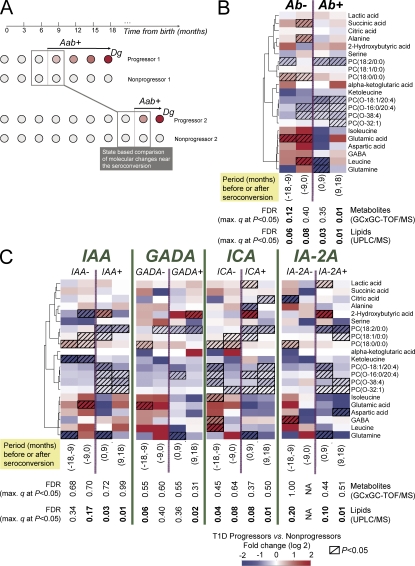
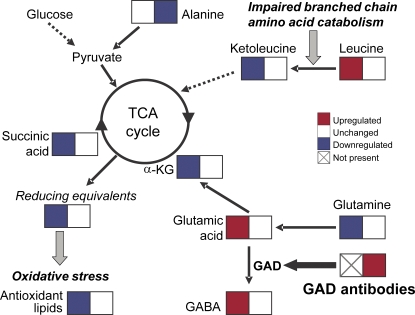
The risk determinants of type 1 diabetes, initiators of autoimmune response, mechanisms regulating progress toward beta cell failure, and factors determining time of presentation of clinical diabetes are poorly understood. We investigated changes in the serum metabolome prospectively in children who later progressed to type 1 diabetes. Serum metabolite profiles were compared between sample series drawn from 56 children who progressed to type 1 diabetes and 73 controls who remained nondiabetic and permanently autoantibody negative. Individuals who developed diabetes had reduced serum levels of succinic acid and phosphatidylcholine (PC) at birth, reduced levels of triglycerides and antioxidant ether phospholipids throughout the follow up, and increased levels of proinflammatory lysoPCs several months before seroconversion to autoantibody positivity. The lipid changes were not attributable to HLA-associated genetic risk. The appearance of insulin and glutamic acid decarboxylase autoantibodies was preceded by diminished ketoleucine and elevated glutamic acid. The metabolic profile was partially normalized after the seroconversion. Autoimmunity may thus be a relatively late response to the early metabolic disturbances. Recognition of these preautoimmune alterations may aid in studies of disease pathogenesis and may open a time window for novel type 1 diabetes prevention strategies.


Figures

Figure 1.
Figure 1.
Subject selection flowchart for the metabolomics study. Nonprogressors were matched with progressors for time and site of birth, gender, and HLA risk group. Status of DIPP (6) and STRIP (12) studies as of June 6, 2006.
Figure 2.
Figure 2.
Selected autoantibody and metabolite changes during the prediabetic period in a girl who progressed to type 1 diabetes at close to 9 yr of age (HLA-haplotype DR7-DQ2/DR4-DQ8, moderate genetic risk). (A) GADA and IAA profiles. The relative autoantibody level values are calculated as the ratio of their measured levels and corresponding cutoff limits for autoantibody positivity. Scales are linear and adjusted separately for each autoantibody for clarity. Time of seroconversion to positivity for each autoantibody is marked, as is the time of diagnosis of type 1 diabetes. The child also seroconverted to ICA and IA-2A autoantibody positivity within 6 mo before the appearance of IAA. (B) Changes of ketoleucine, leucine, lysoPC (the profile shown is for the most abundant lysoPC species PC(18:0/0:0)), and ether PC (the profile shown is for the most abundant ether PC species PC(O-18:1/20:4)) with age. Fold changes are calculated as ratios of metabolite level at a given time point and the normal level, i.e., the mean value across all samples in the nonprogressors. Scales are linear and adjusted separately for each metabolite for clarity. (C) The changes of glutamic acid, GABA, α-ketoglutarate (α-KG), and glutamine with age.
Figure 3.
Figure 3.
Serum lipidome in cord blood and prospective sample series. (A) Differences in serum lipidome between the progressors to type 1 diabetes and nonprogressors who remained autoantibody negative throughout the follow up. The age groups are divided into birth (cord blood) and then into groups covering 1-yr cohorts. Only one sample per subject, closest to the mean age within the time window, is used in each comparison. The number of subjects included in each age cohort is shown at the bottom. The last sample of each progressor was the sample drawn last before diagnosis of diabetes. (B) Total triglyceride and ether PC concentrations for the age cohorts shown in A calculated as the sum of lipid concentrations within each class. Both lipid classes were found consistently down-regulated in the progressors, as tested by the linear mixed effects model for the overall trend throughout the follow up. The error bars show SEM. (C) Levels of the lysoPC PC(18:0/0:0) and the ether PC PC(O-18:1/20:4) at the age of 18 mo for DIPP children. The two lipids were up-regulated (P = 0.0009) and down-regulated (P = 0.04) in progressors, respectively. Only one measurement, closest to the age of 18 mo within the 12–24-mo age interval is shown for each subject. Subjects who already seroconverted to autoantibody positivity against one or multiple islet autoantigens are specifically marked with different colors, whereas the subjects in moderate and high HLA-conferred risk groups, as defined in Table I, are marked with circles and squares, respectively.
Figure 4.
Figure 4.
Comparison of serum metabolomes between progressors to type 1 diabetes and nonprogressors who remained autoantibody negative throughout the follow up. The age groups are divided into birth (cord blood) and then into groups covering 1-yr periods of followup. Only one sample per subject, closest to the mean age within the time window (0.5, 1.5, 2.5 yr, etc.), is used in each comparison. Clustering was performed for the profiles across all available samples (n = 419) using Ward linkage and the nonparametric Spearman rank correlation–based distance metric. The number of subjects included in each age cohort is shown at the bottom.
Figure 5.
Figure 5.
Selected metabolite differences between progressors and nonprogressors within 18-mo periods before and after seroconversion to islet autoantibody positivity, divided into four 9-mo periods. (A) Illustrative matching of progressors and nonprogressors for studies of seroconversion-related changes in metabolome. For each progressor's samples near the selected period of seroconversion, the age-matched control samples were selected from the matched nonprogressor. (B) Changes before (Ab) and after (Ab+) first seroconversion to islet autoantibody positivity. Only one sample from each subject, closest to the time of seroconversion, is included within each time period. Clustering was performed as described in Fig. 4. (C) Changes before and after seroconversion to positivity for each autoantibody. Only one sample from each subject, closest to the time of seroconversion, is included within each time period. Lipids were measured in 56 progressors and 73 nonprogressors, whereas the metabolites were measured in 13 progressors and 26 nonprogressors as shown in Table S1.
Figure 6.
Figure 6.
Biochemical model of metabolic changes in progressors to type 1 diabetes prior and after seroconversion to islet autoimmunity. Detected changes of specific metabolites of citric acid cycle and glutamic acid metabolism before (left boxes) and shortly after (right boxes) the appearance of GADA are shown.

Comment in

References

    1. Gale, E.A.M. 2002. The rise of childhood type 1 diabetes in the 20th century. Diabetes. 51:3353–3361. - PubMed
    1. Knip, M., R. Veijola, S.M. Virtanen, H. Hyöty, O. Vaarala, and H.K. Åkerblom. 2005. Environmental triggers and determinants of type 1 diabetes. Diabetes. 54:S125–S136. - PubMed
    1. Tuomilehto, J., M. Karvonen, J. Pitkäniemi, E. Virtala, K. Kohtamäki, L. Toivanen, and E. Tuomilehto-Wolf. 1999. Record-high incidence of type 1 (insulin-dependent) diabetes mellitus in Finnish children. Diabetologia. 42:655–660. - PubMed
    1. Harjutsalo, V., L. Sjöberg, and J. Tuomilehto. 2008. Time trends in the incidence of type 1 diabetes in Finnish children: a cohort study. Lancet. 371:1777–1782. - PubMed
    1. Achenbach, P., E. Bonifacio, K. Koczwara, and A.-G. Ziegler. 2005. Natural history of type 1 diabetes. Diabetes. 54:S25–S31. - PubMed

Publication types

MeSH terms